Inulin 图表
31 来自同行评审研究的图表
Metabolomic analysis of fecal samples following inulin intervention reveals significant changes in short-chain fatty acid profiles, particularly increased butyrate and propionate concentrations. These metabolic shifts correlate with specific microbial community changes.
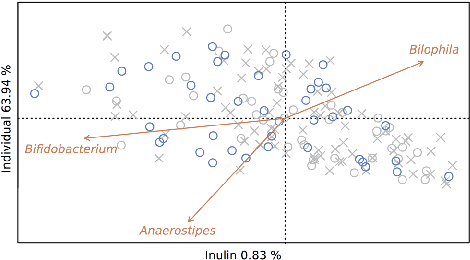
Prebiotic inulin-type fructans induce specific changes in the human gut microbiota.
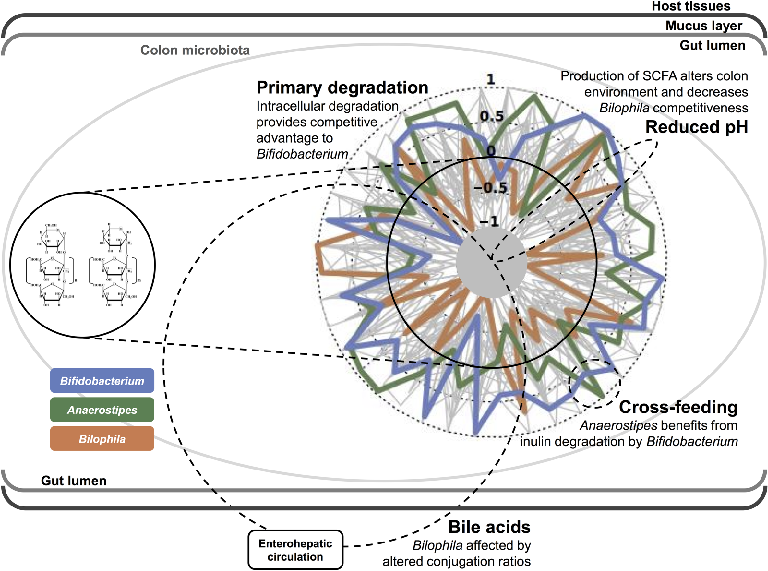
Gut microbiota composition changes induced by inulin-type fructans are characterized by increased abundance of Bifidobacterium, Faecalibacterium, and Anaerostipes, alongside decreased levels of Bilophila. These shifts are associated with altered fecal metabolite profiles.
Prebiotic inulin-type fructans induce specific changes in the human gut microbiota.
Clinical evidence for probiotic efficacy in ulcerative colitis is stronger than for Crohn's disease, with certain multi-strain formulations showing benefit in maintaining remission. Strain-specific effects are critical, as not all probiotics demonstrate equivalent therapeutic potential.
Role of prebiotics, probiotics, and synbiotics in management of inflammatory bowel disease: …
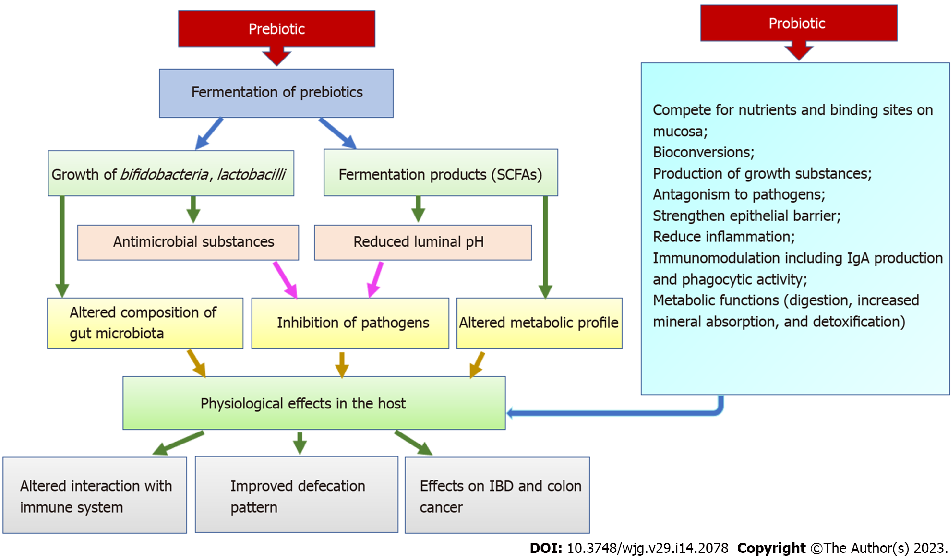
Gut microbiota composition in IBD patients is characterized by reduced diversity, decreased Firmicutes abundance, and increased representation of potentially pathogenic Proteobacteria. Probiotic interventions aim to partially normalize these patterns.
Role of prebiotics, probiotics, and synbiotics in management of inflammatory bowel disease: …

Fecal calprotectin and other inflammatory biomarkers may serve as objective measures for monitoring probiotic treatment response in IBD patients. Reductions in these markers correlate with clinical improvement in several studies.
Role of prebiotics, probiotics, and synbiotics in management of inflammatory bowel disease: …
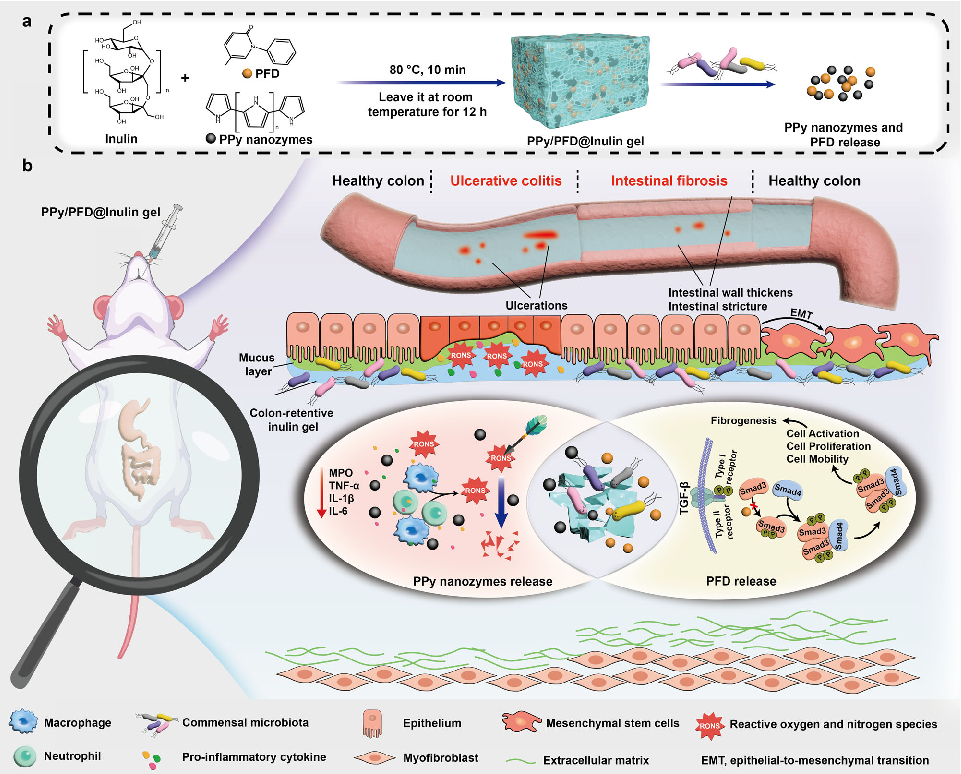
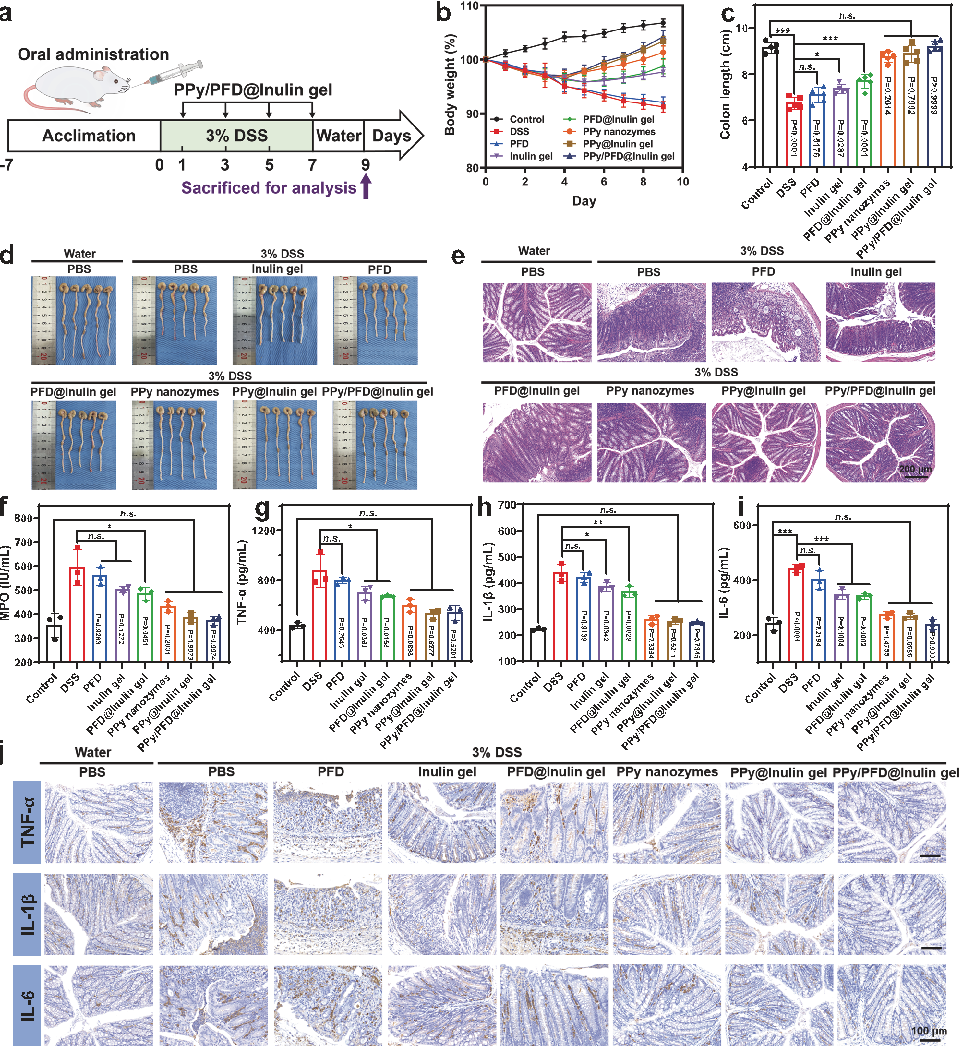
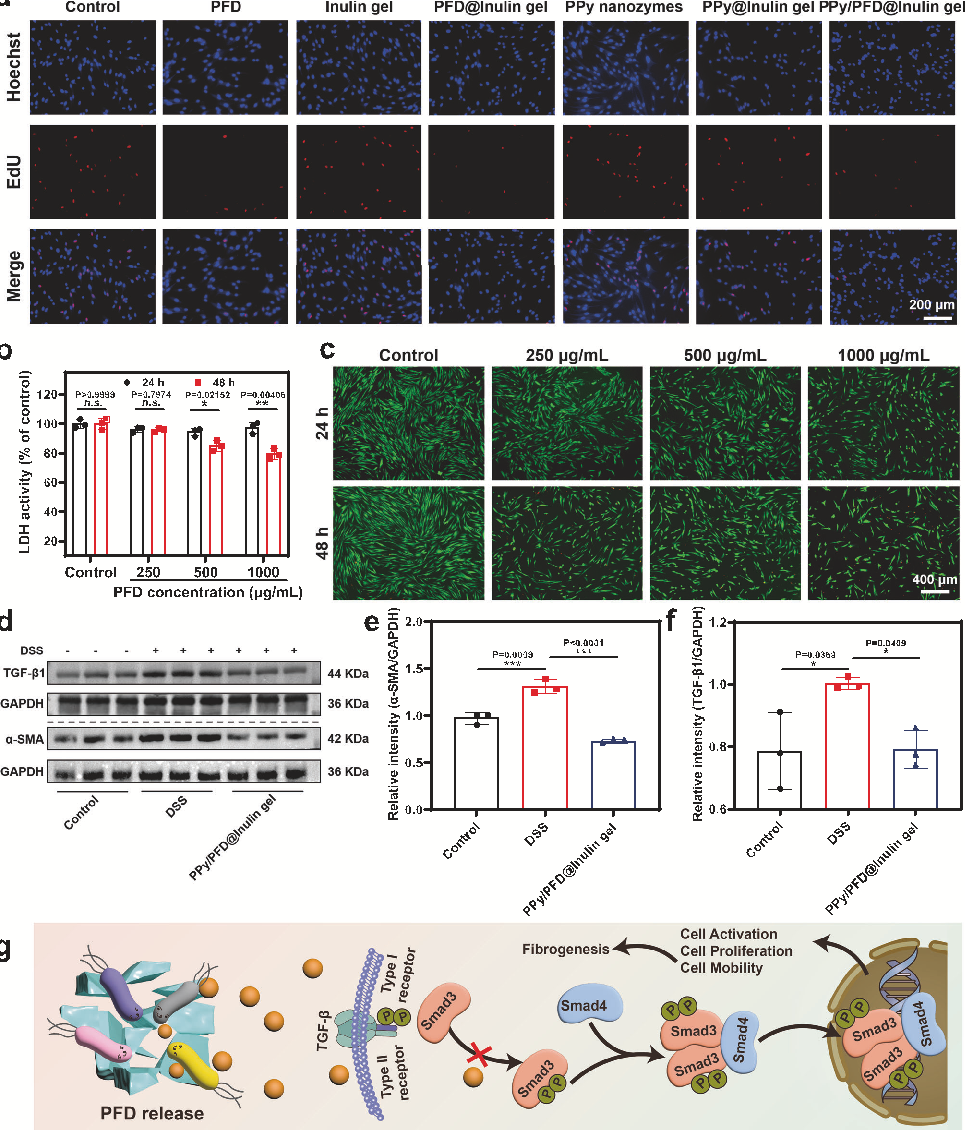
In vitro or in vivo efficacy data for the inulin hydrogel system, evaluating anti-inflammatory and anti-fibrotic effects in intestinal tissue models.
Ternary inulin hydrogel with long-term intestinal retention for simultaneously reversing IBD and …
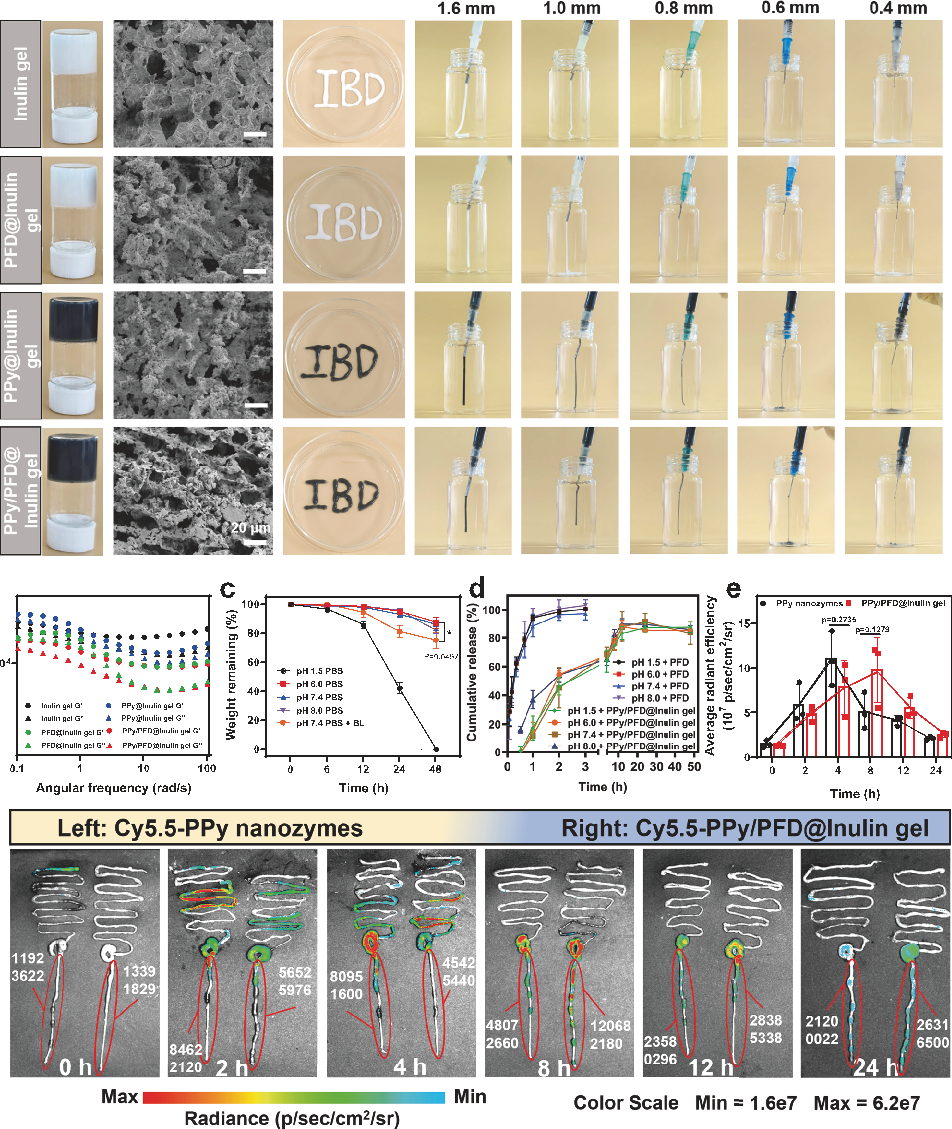
In vitro or in vivo efficacy data for the inulin hydrogel system, evaluating anti-inflammatory and anti-fibrotic effects in intestinal tissue models.
Ternary inulin hydrogel with long-term intestinal retention for simultaneously reversing IBD and …
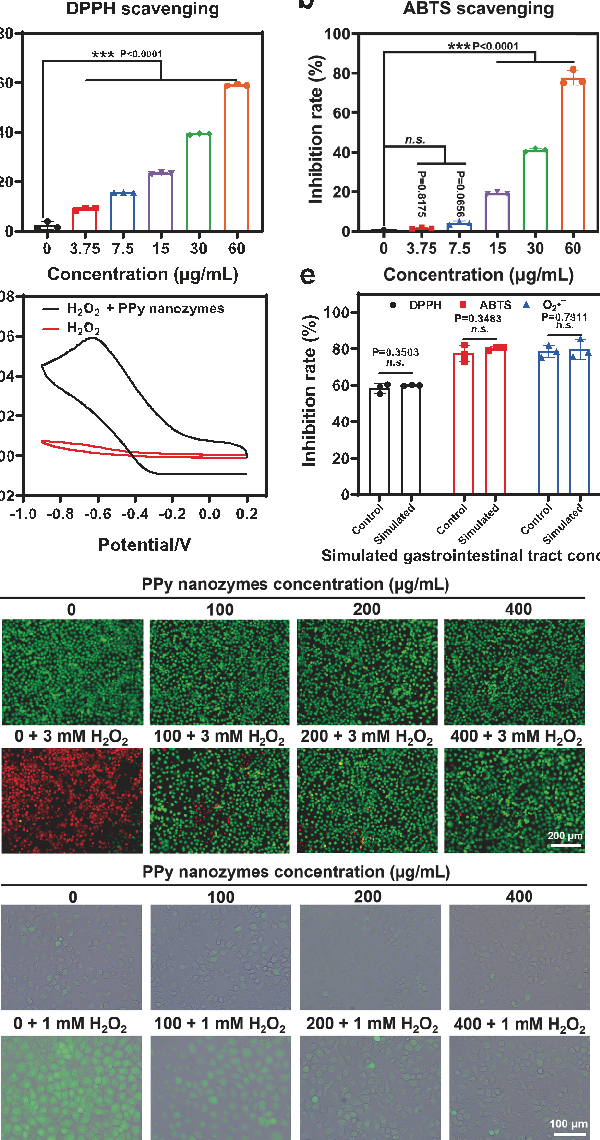
In vitro or in vivo efficacy data for the inulin hydrogel system, evaluating anti-inflammatory and anti-fibrotic effects in intestinal tissue models.
Ternary inulin hydrogel with long-term intestinal retention for simultaneously reversing IBD and …
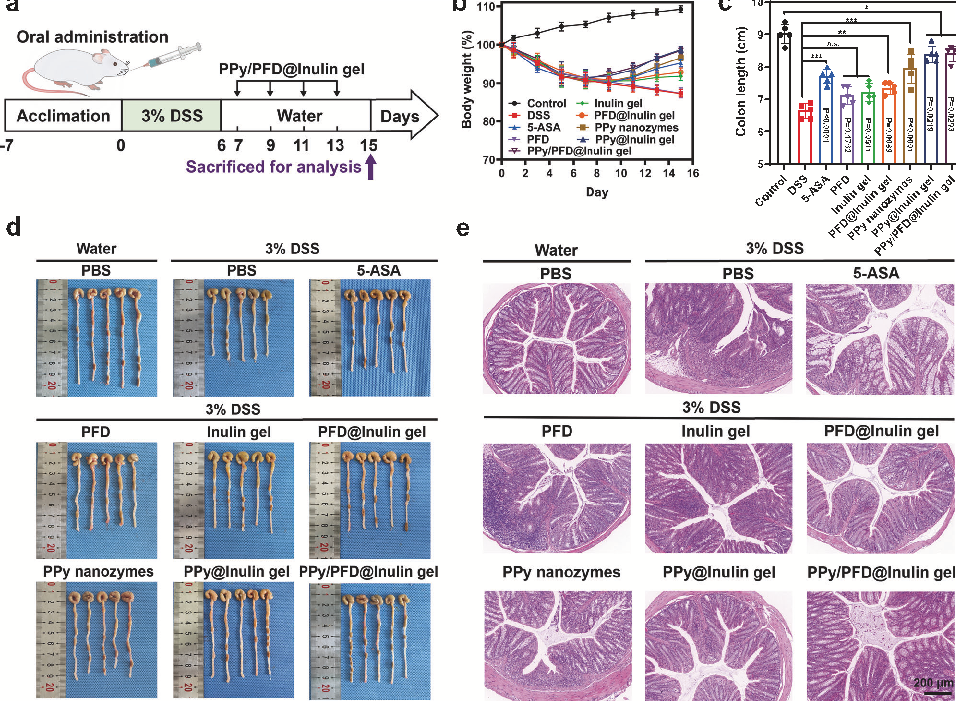
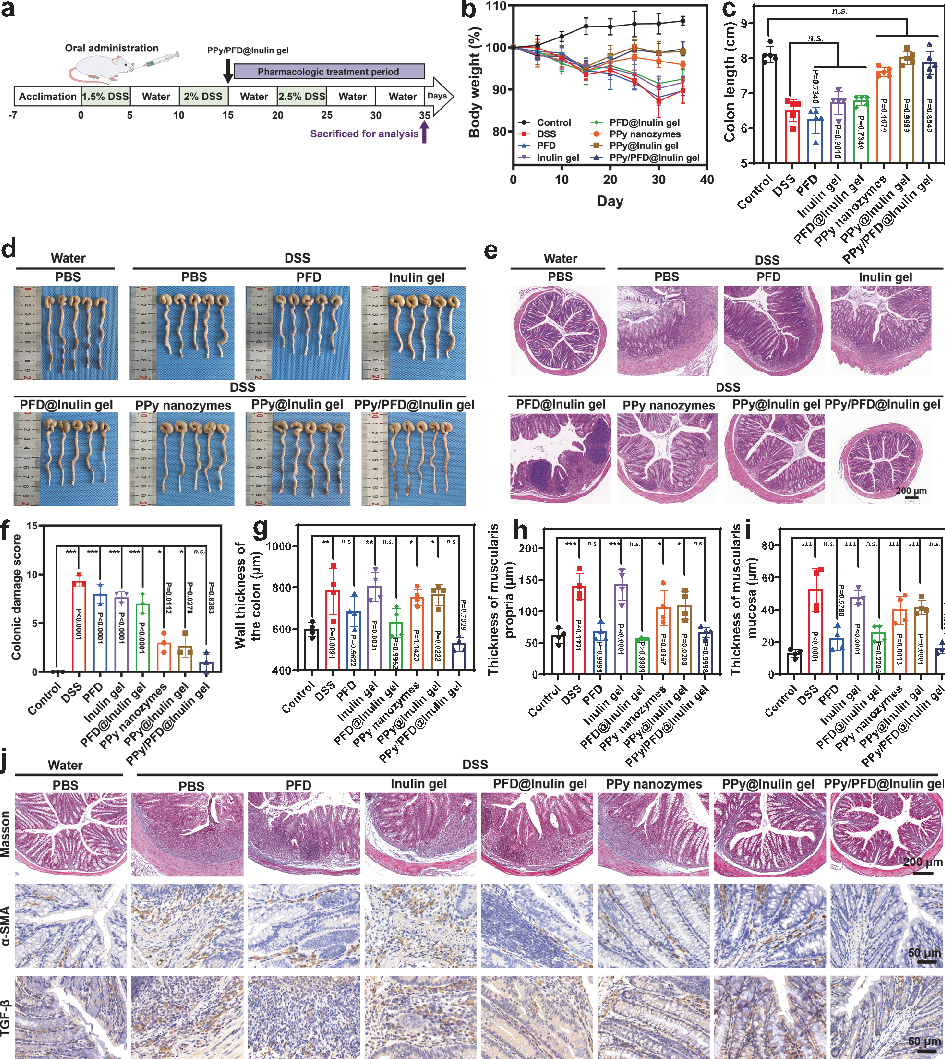
Therapeutic outcome measurements from the DSS-induced colitis model treated with the inulin hydrogel, assessing colon histology, inflammatory markers, and fibrosis resolution.
Ternary inulin hydrogel with long-term intestinal retention for simultaneously reversing IBD and …
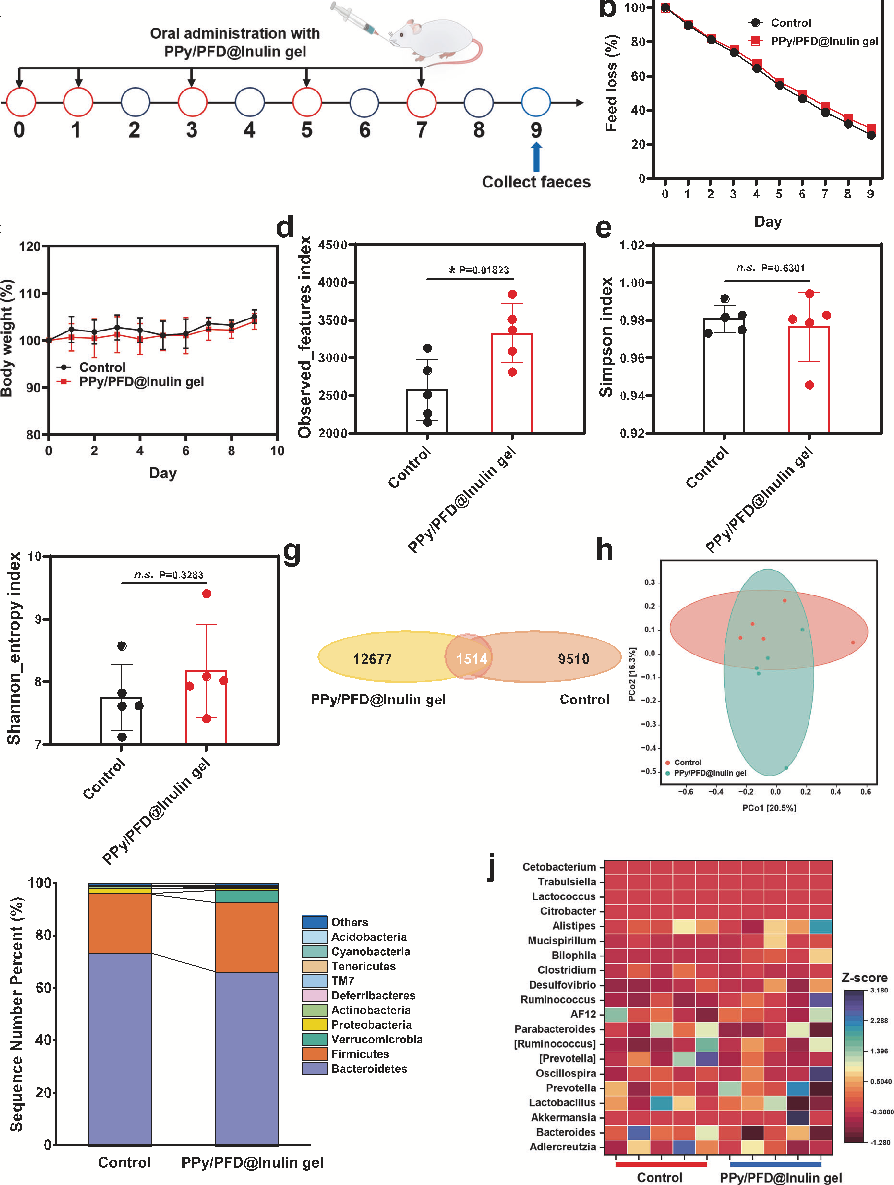
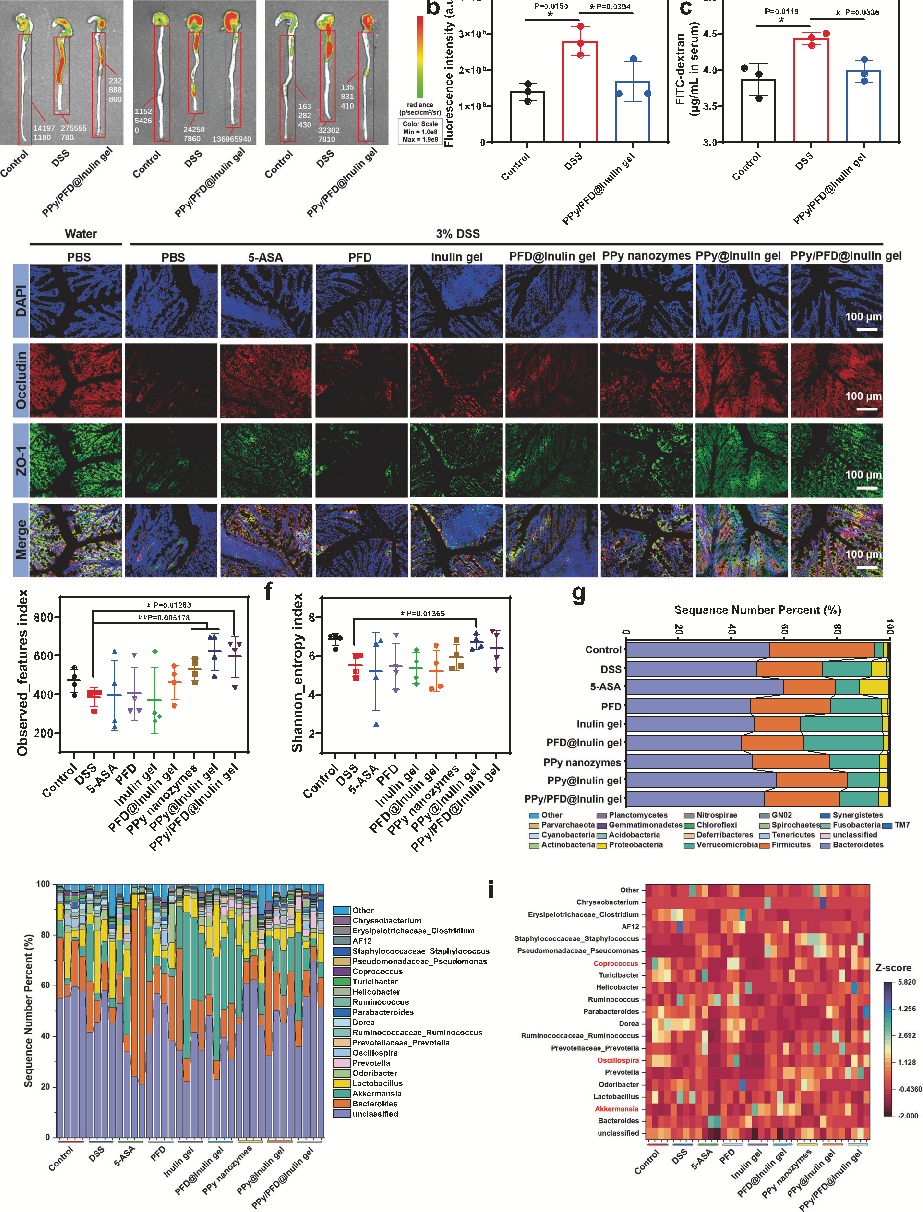
Intestinal microbiome restoration data following inulin hydrogel treatment, showing probiotic-mediated recovery of microbial diversity and beneficial bacterial populations.
Ternary inulin hydrogel with long-term intestinal retention for simultaneously reversing IBD and …
Supplementary characterization or mechanistic data from the ternary inulin hydrogel study, providing additional evidence for the dual anti-inflammatory and anti-fibrotic therapeutic approach.
Ternary inulin hydrogel with long-term intestinal retention for simultaneously reversing IBD and …
Supplementary characterization or mechanistic data from the ternary inulin hydrogel study, providing additional evidence for the dual anti-inflammatory and anti-fibrotic therapeutic approach.
Ternary inulin hydrogel with long-term intestinal retention for simultaneously reversing IBD and …
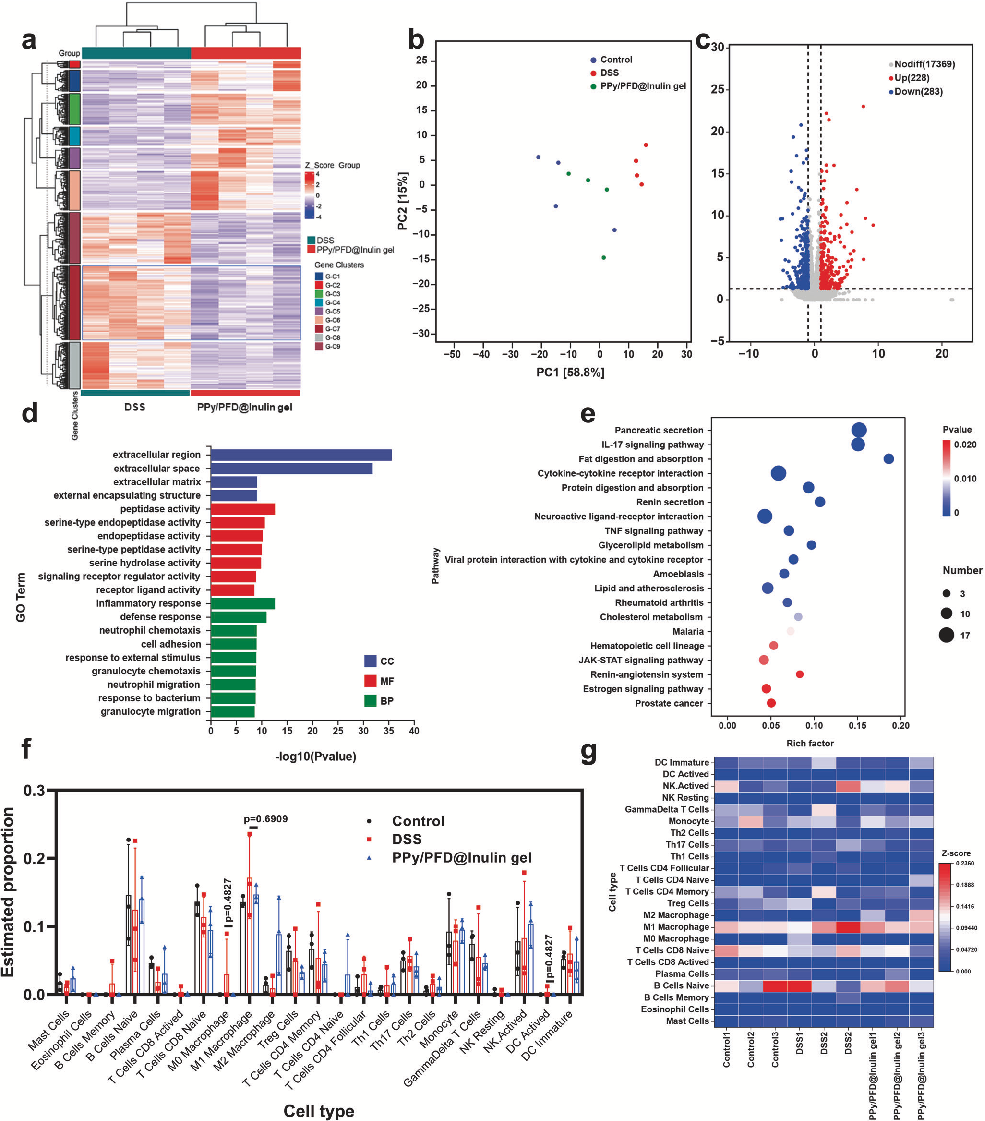
Supplementary characterization or mechanistic data from the ternary inulin hydrogel study, providing additional evidence for the dual anti-inflammatory and anti-fibrotic therapeutic approach.
Ternary inulin hydrogel with long-term intestinal retention for simultaneously reversing IBD and …
Supplementary characterization or mechanistic data from the ternary inulin hydrogel study, providing additional evidence for the dual anti-inflammatory and anti-fibrotic therapeutic approach.
Ternary inulin hydrogel with long-term intestinal retention for simultaneously reversing IBD and …
Supplementary characterization or mechanistic data from the ternary inulin hydrogel study, providing additional evidence for the dual anti-inflammatory and anti-fibrotic therapeutic approach.
Ternary inulin hydrogel with long-term intestinal retention for simultaneously reversing IBD and …
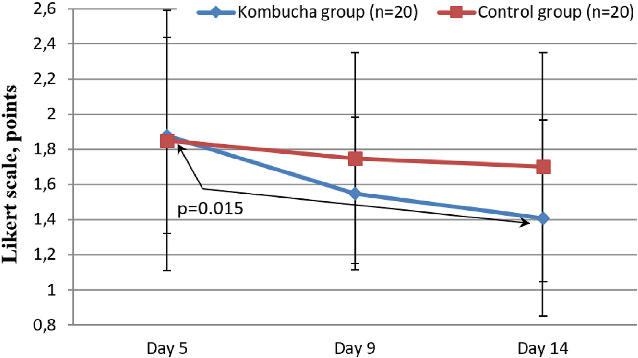
Comparison of bloating severity scores between the kombucha intervention group and control group over the study period. Reductions in bloating severity suggest the enriched kombucha drink may be associated with symptomatic improvement in IBS-C patients.
Evaluation of the Efficacy of Kombucha-Based Drink Enriched with Inulin and Vitamins …
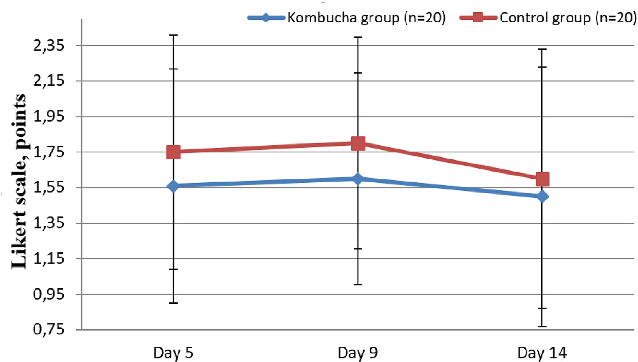
Assessment of the feeling of incomplete bowel emptying in IBS-C patients receiving the kombucha-based drink versus controls. Severity scores at multiple timepoints indicate a trend toward improvement in the intervention group.
Evaluation of the Efficacy of Kombucha-Based Drink Enriched with Inulin and Vitamins …
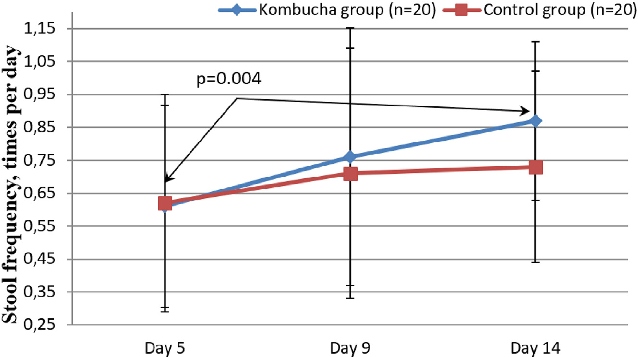
Stool frequency data comparing the kombucha intervention and control groups across the study timeline. Increased bowel movement frequency in the treatment group suggests a potential benefit of the inulin- and vitamin-enriched kombucha formulation.
Evaluation of the Efficacy of Kombucha-Based Drink Enriched with Inulin and Vitamins …
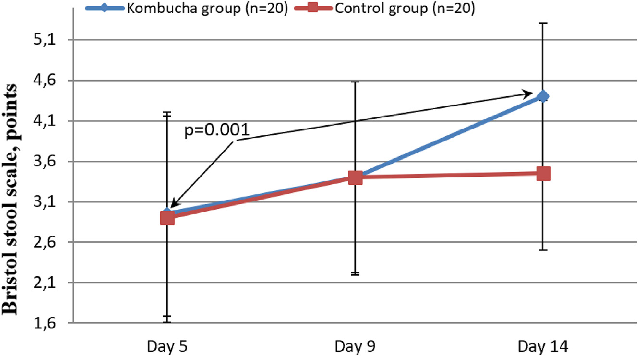
Stool consistency scores evaluated using the Bristol Stool Scale for both study groups. Improvements in stool consistency over the intervention period suggest the kombucha-based drink may help normalize bowel habits in IBS-C patients.
Evaluation of the Efficacy of Kombucha-Based Drink Enriched with Inulin and Vitamins …
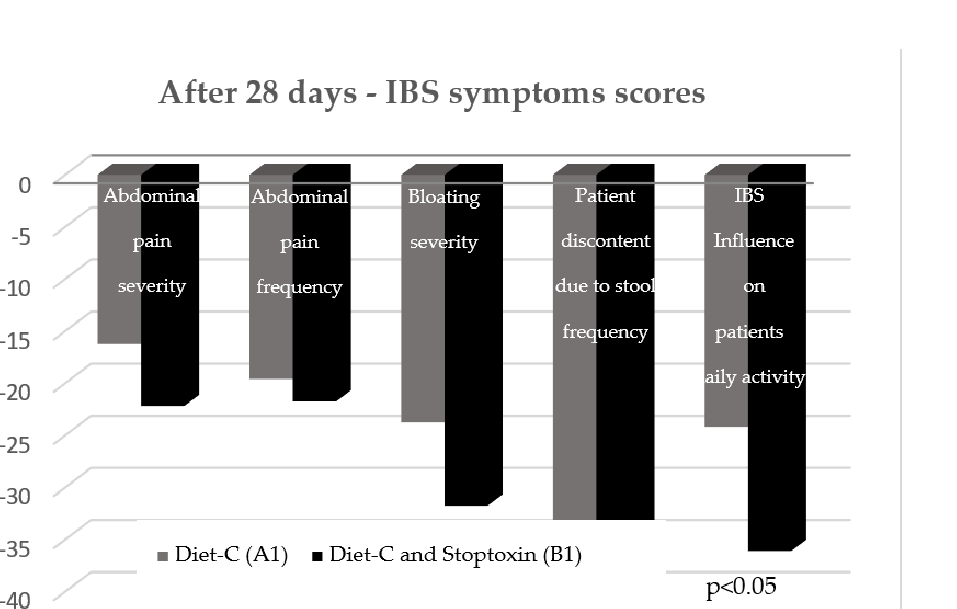
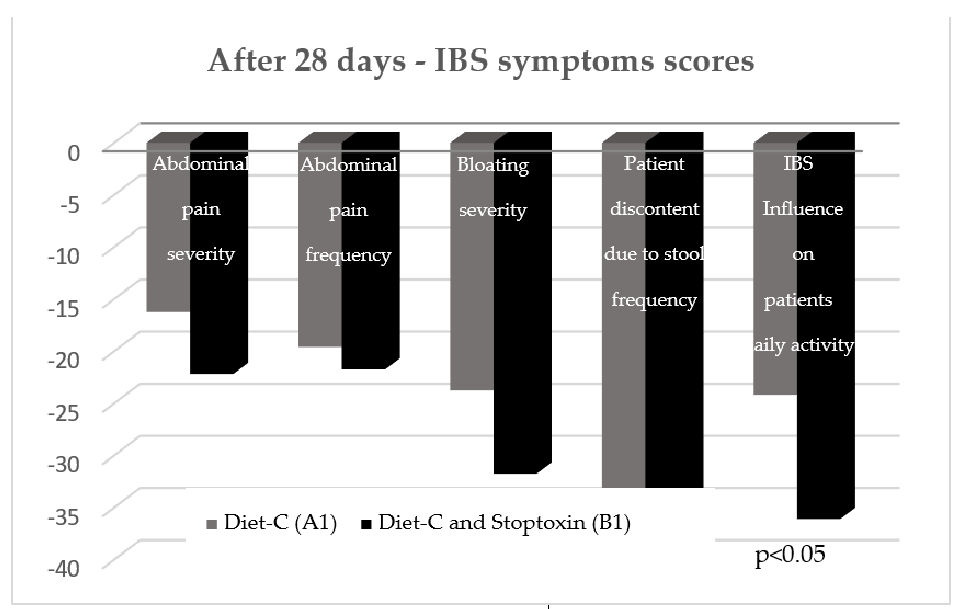
Comparative analysis of individual IBS symptom domains across treatment groups, evaluating the differential effects of the inulin-choline-silymarin supplement.
Inulin, Choline and Silymarin in the Treatment of Irritable Bowel Syndrome with …
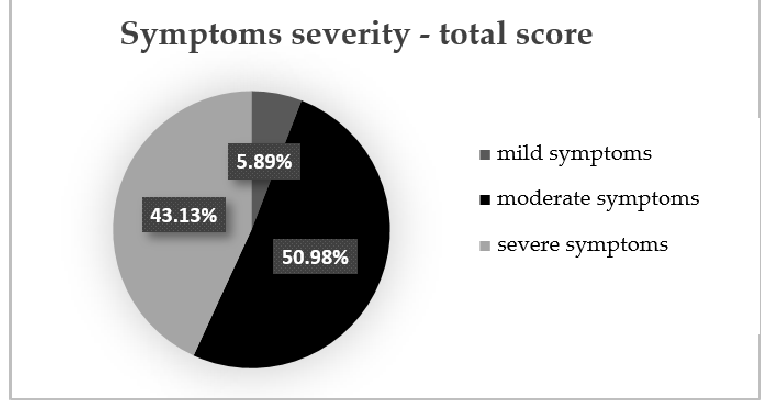
Symptom severity distribution at the initial evaluation, revealing that approximately half of the IBS-C patients presented with moderate symptoms while over 40% had severe manifestations.
Inulin, Choline and Silymarin in the Treatment of Irritable Bowel Syndrome with …
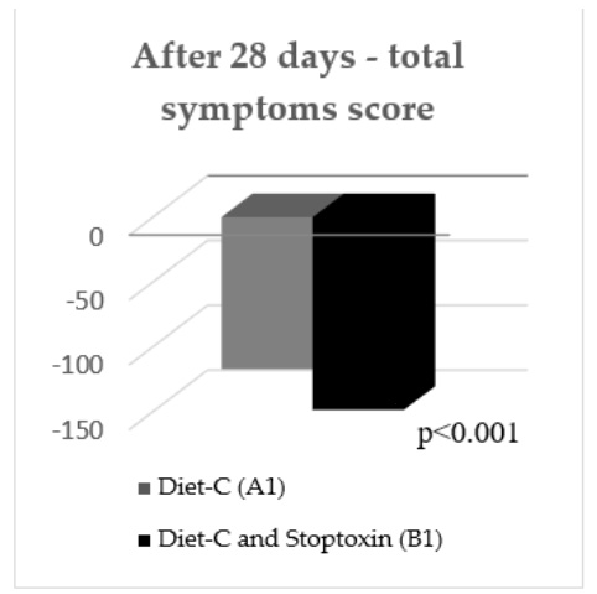
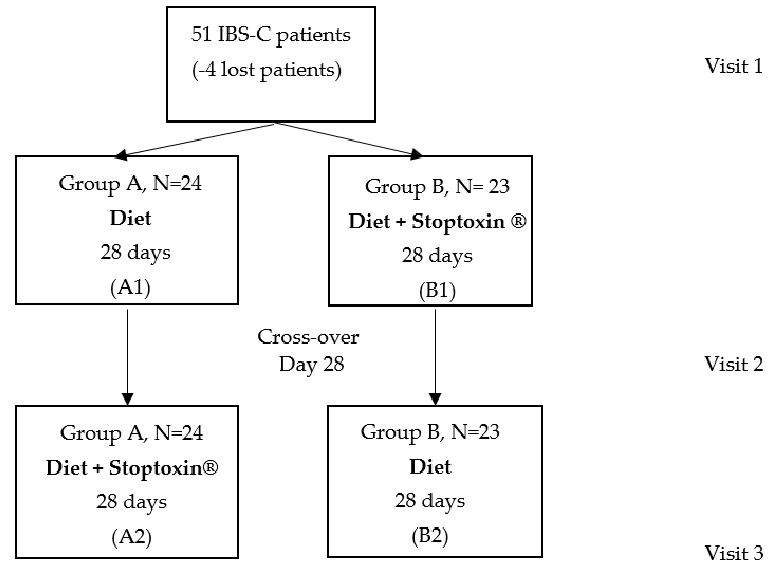
Total IBS symptom scores measured at the 28-day assessment point, comparing outcomes between the supplemented and control diet groups in the crossover design.
Inulin, Choline and Silymarin in the Treatment of Irritable Bowel Syndrome with …
Analysis of gastrointestinal symptom domains in the IBS-C study at an intermediate time point, tracking changes in bloating, pain, and bowel habit parameters.
Inulin, Choline and Silymarin in the Treatment of Irritable Bowel Syndrome with …
Stool frequency and consistency measurements during the treatment phase, evaluating whether inulin-based supplementation improved bowel regularity in IBS-C patients.
Inulin, Choline and Silymarin in the Treatment of Irritable Bowel Syndrome with …
第 1 页,共 2 页