Galactooligosaccharides (GOS) चित्र
6 सहकर्मी-समीक्षित शोध से आंकड़े
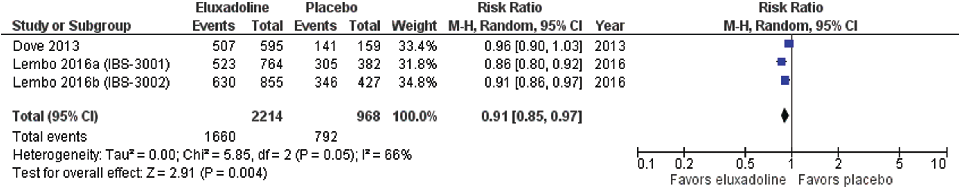
Polyethylene glycol 3350 is evaluated for IBS with constipation based on two RCTs totaling 181 patients. Evidence supports its use for improving stool consistency, though effects on abdominal pain are less consistent.
Canadian Association of Gastroenterology Clinical Practice Guideline for the Management of Irritable …
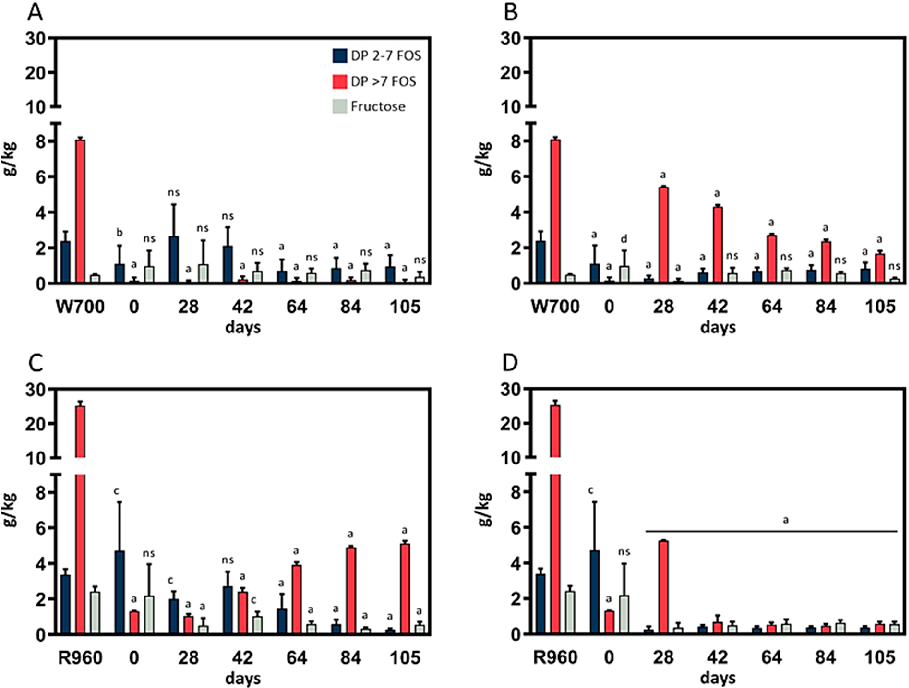
Fructose, DP 2–7 FOS, and DP >7 FOS content of sourdough (35 g water; 35 g flour). p < 0.05 (c), p < 0.01 (b), and p < 0.0001 (a) indicate significant differences from the control.
FODMAP Fingerprinting of Bakery Products and Sourdoughs: Quantitative Assessment and Content Reduction …
Statistical analysis from research investigating FODMAP Fingerprinting of Bakery Products and Sourdoughs, comparing treatment groups and control conditions.
FODMAP Fingerprinting of Bakery Products and Sourdoughs: Quantitative Assessment and Content Reduction …
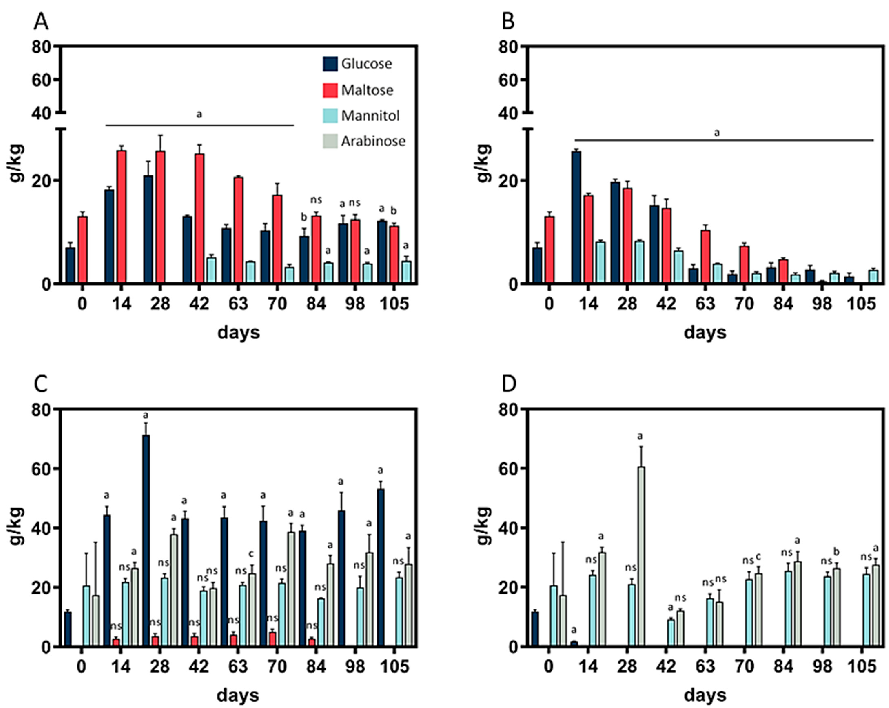
Arabinose, glucose, maltose, and mannitol contents of sourdough. (A) Wheat sourdough; 4 °C; W700.
FODMAP Fingerprinting of Bakery Products and Sourdoughs: Quantitative Assessment and Content Reduction …
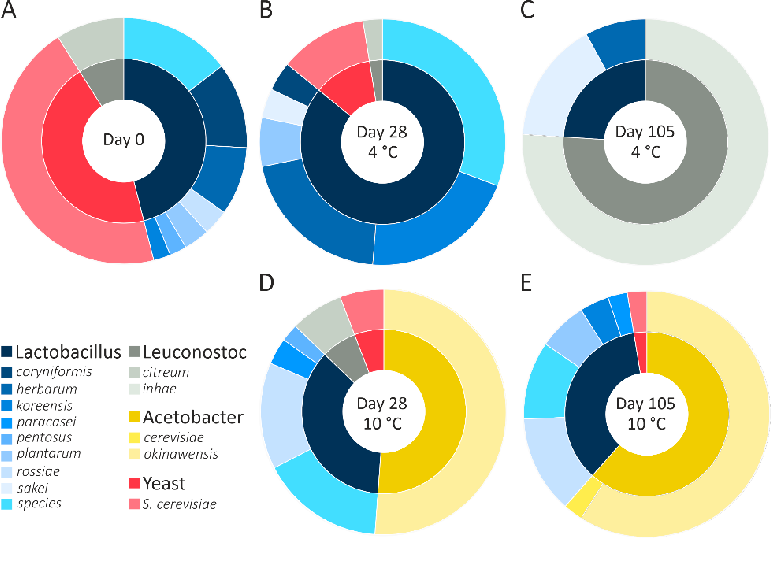
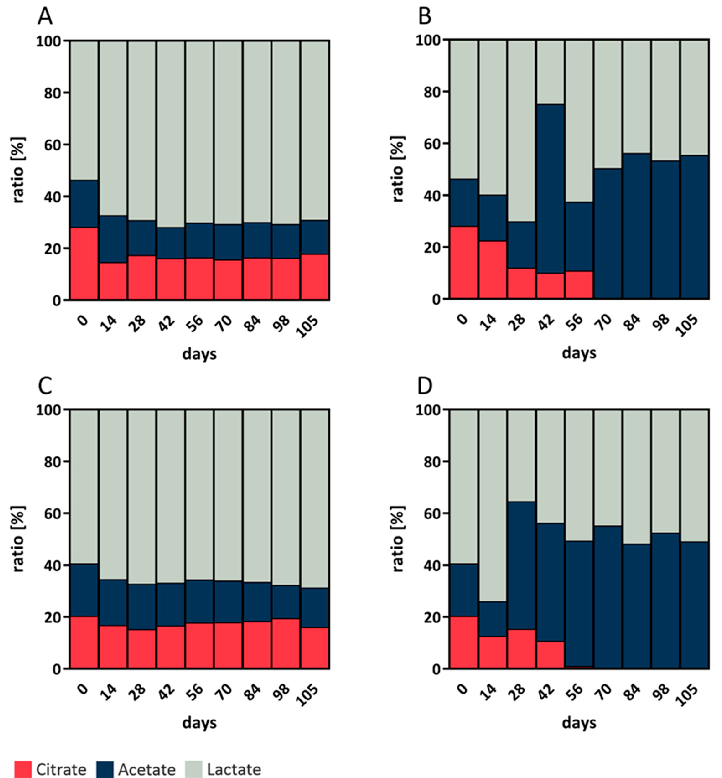
Graphical representation of outcomes in a study of FODMAP Fingerprinting of Bakery Products and Sourdoughs, highlighting trends observed across experimental conditions.
FODMAP Fingerprinting of Bakery Products and Sourdoughs: Quantitative Assessment and Content Reduction …
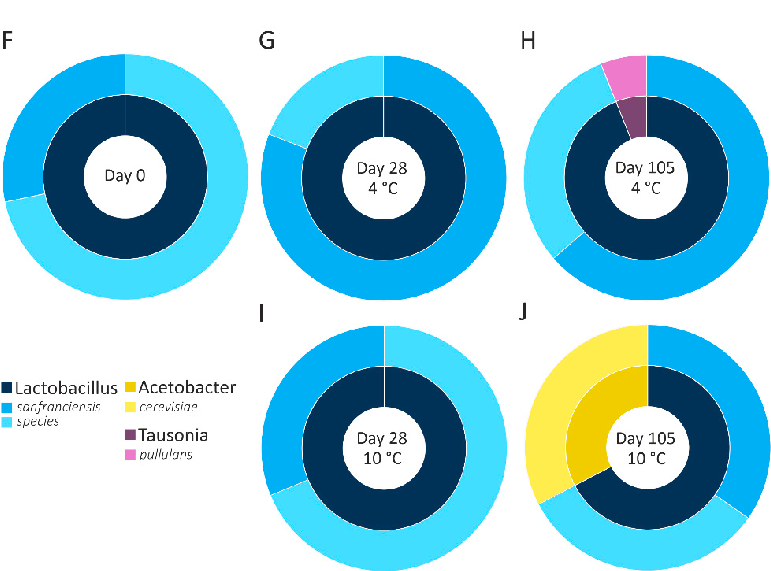
Quantitative data from a study on FODMAP Fingerprinting of Bakery Products and Sourdoughs, presenting measured outcomes relevant to the investigation of fermentable oligo-, di-, and monosaccharides and polyols (FODMAPs) are associated with digestive disorders and with d.
FODMAP Fingerprinting of Bakery Products and Sourdoughs: Quantitative Assessment and Content Reduction …