Processus de recherche
477 figures issues de recherches évaluées par des pairs
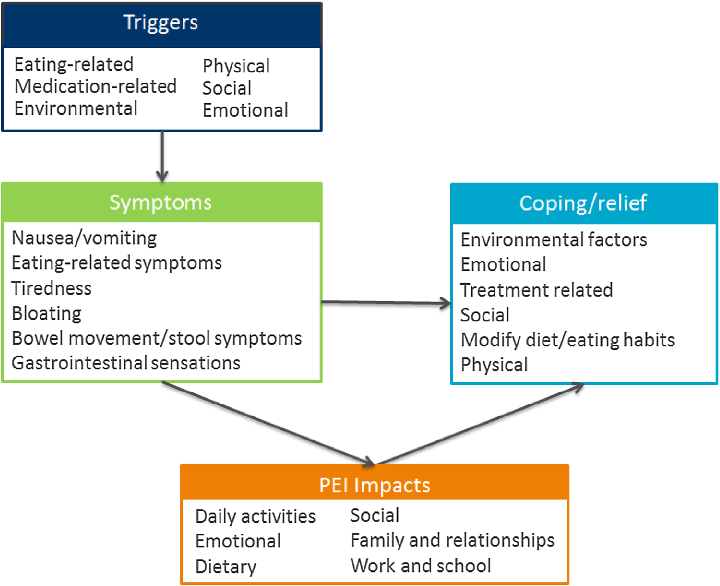
Interview coding results for pancreatic exocrine insufficiency symptoms display the relative importance of different symptom domains as rated by patients.
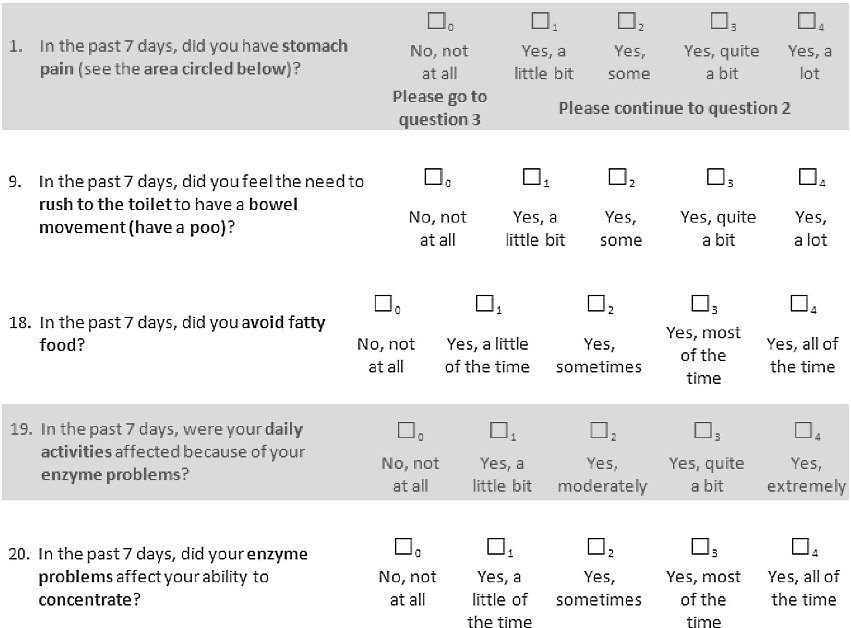
Qualitative Assessment of the Symptoms and Impact of Pancreatic Exocrine Insufficiency (PEI) …
Final conceptual framework for the PEI patient-reported outcome instrument integrates symptom, impact, and treatment-related domains derived from patient input.
Qualitative Assessment of the Symptoms and Impact of Pancreatic Exocrine Insufficiency (PEI) …
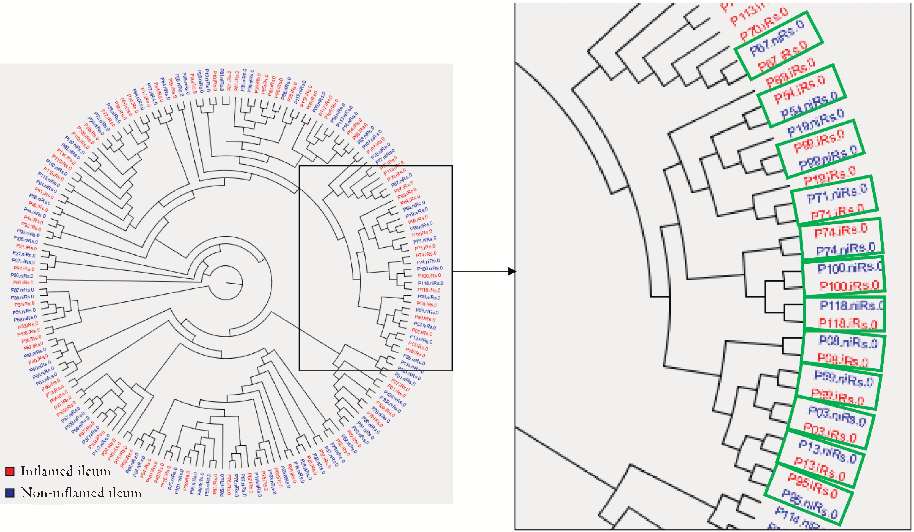
Predictive microbiota signatures for postoperative Crohn's disease recurrence are identified, with specific taxa associated with early endoscopic inflammation at the neoterminal ileum.
Early Postoperative Endoscopic Recurrence in Crohn's Disease Is Characterised by Distinct Microbiota …
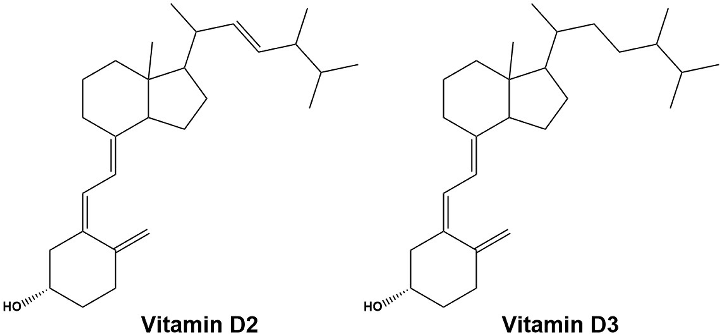
Vitamin D's multifaceted role as an immune modulator is discussed, noting that nearly all immune cells express the vitamin D receptor and that deficiency is closely correlated with increased susceptibility to immune-mediated diseases.
The Role of Vitamin D in Immune System and Inflammatory Bowel Disease.
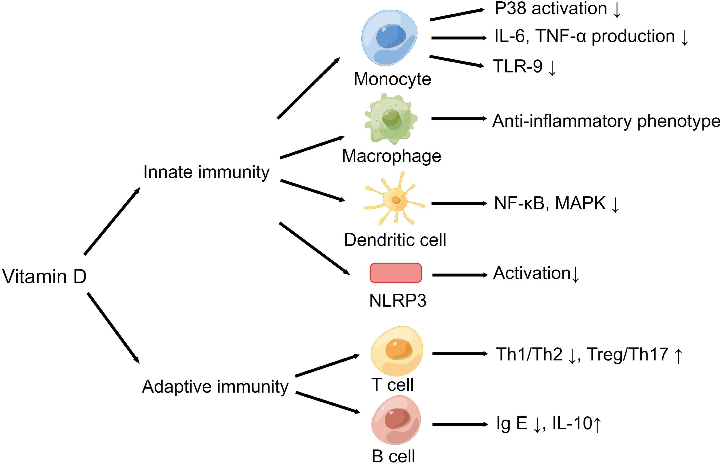
Vitamin D impacts on innate and adaptive immunity are illustrated, showing inhibition of LPS-induced p38 activation, suppression of IL-6 and TNF-alpha by monocytes, and downregulation of TLR-9 expression in immune cells.
The Role of Vitamin D in Immune System and Inflammatory Bowel Disease.
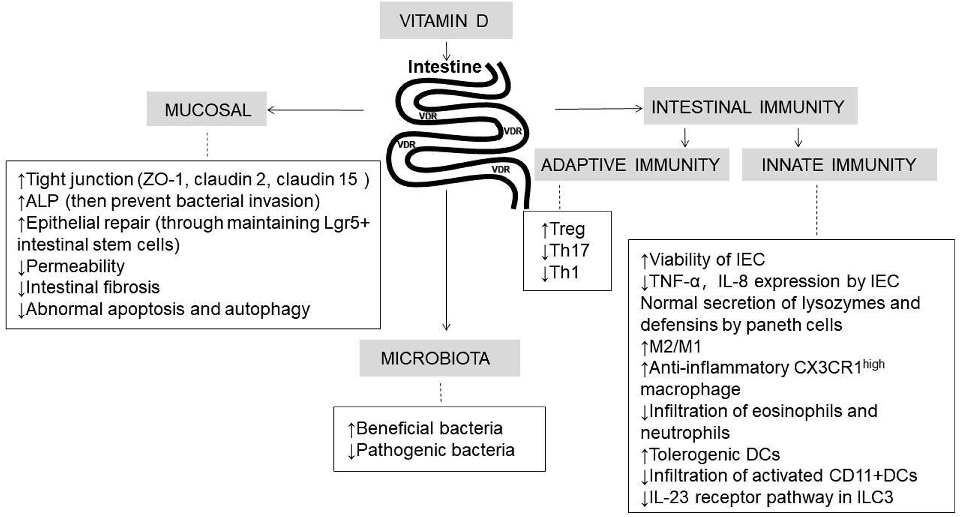
Vitamin D's influence on inflammatory bowel disease development is depicted through three interconnected pathways: intestinal immune regulation, microbiota composition, and mucosal barrier integrity.
The Role of Vitamin D in Immune System and Inflammatory Bowel Disease.
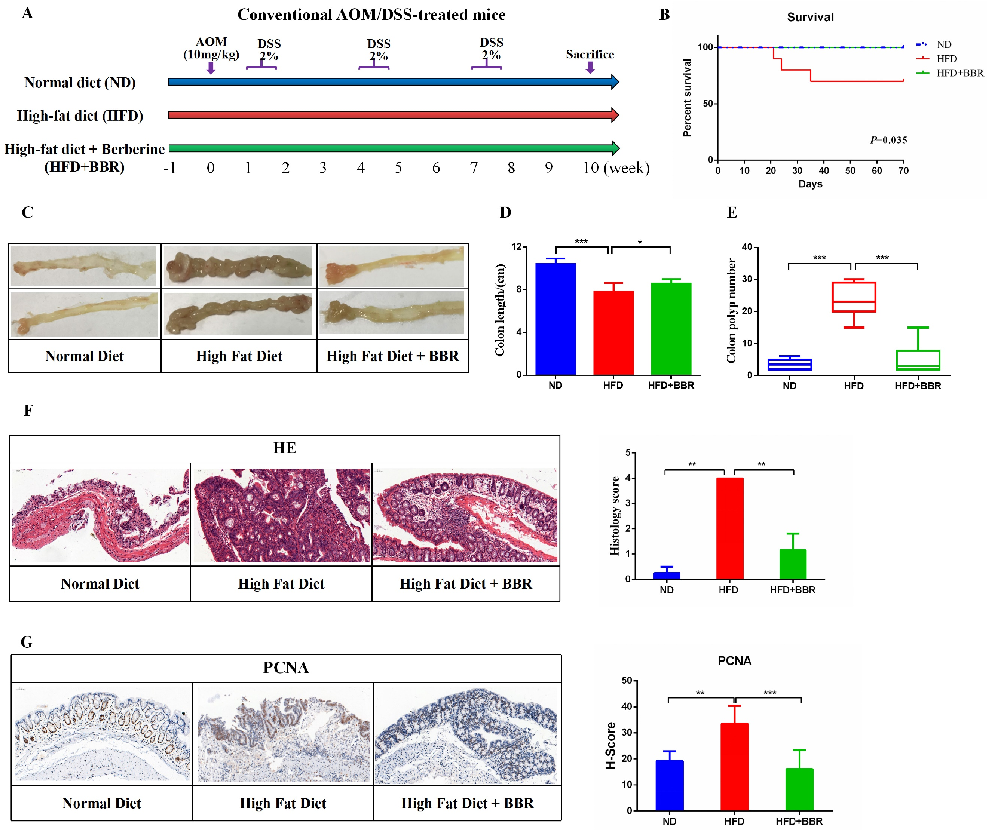
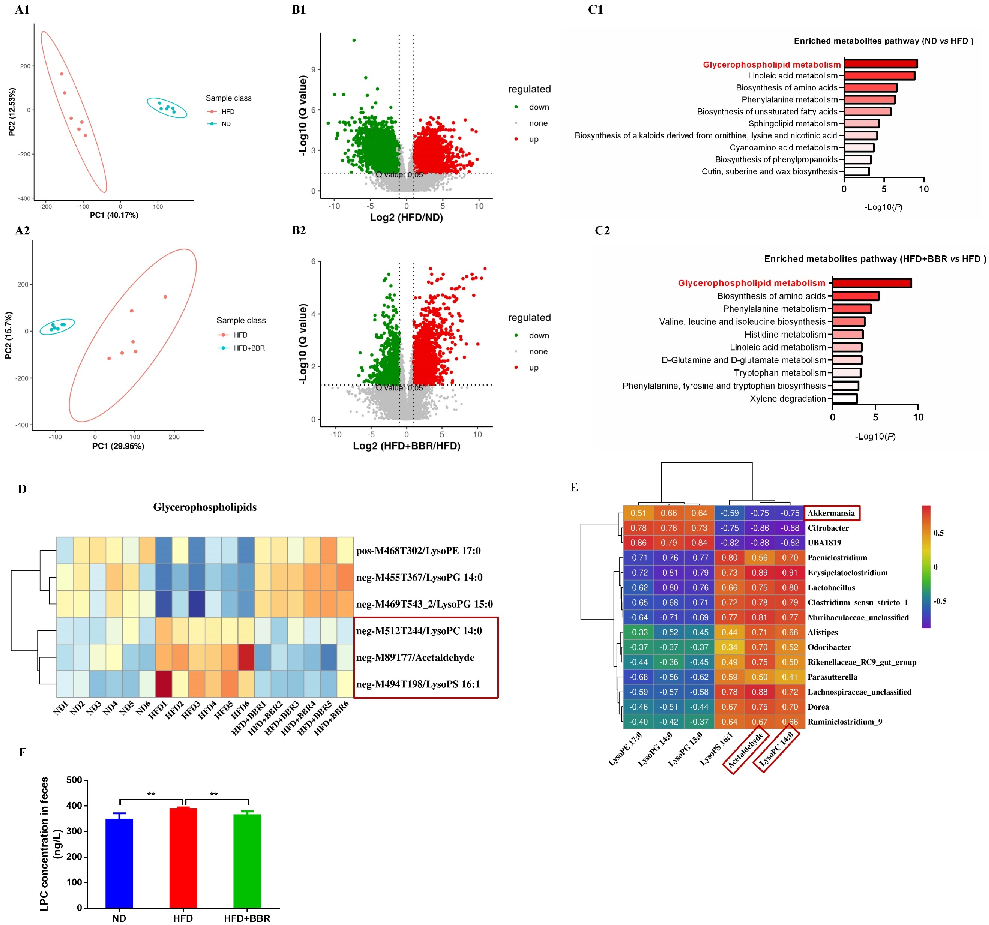
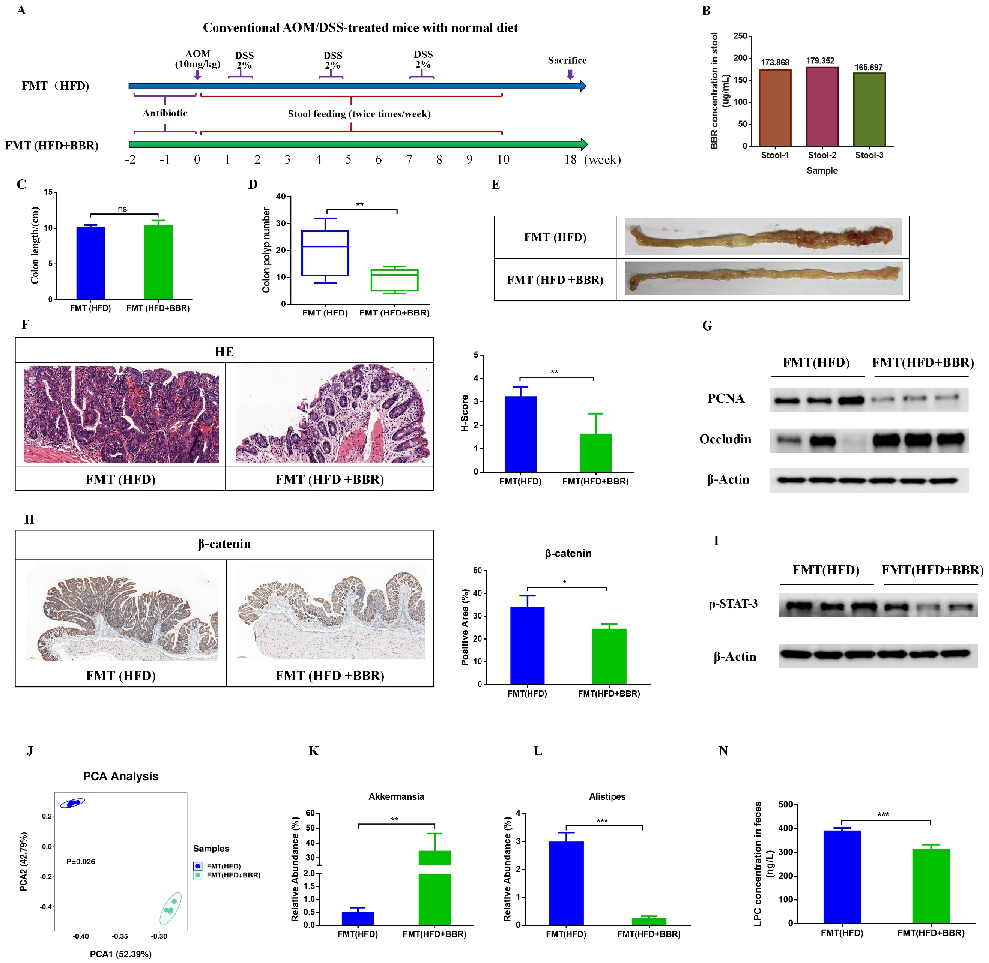
16S rRNA sequencing of gut microbiota reveals that berberine modulates microbial community composition in high-fat diet-fed mice. Specific bacterial genera associated with colorectal cancer risk were reduced in berberine-treated animals.
Berberine inhibits high fat diet-associated colorectal cancer through modulation of the gut …
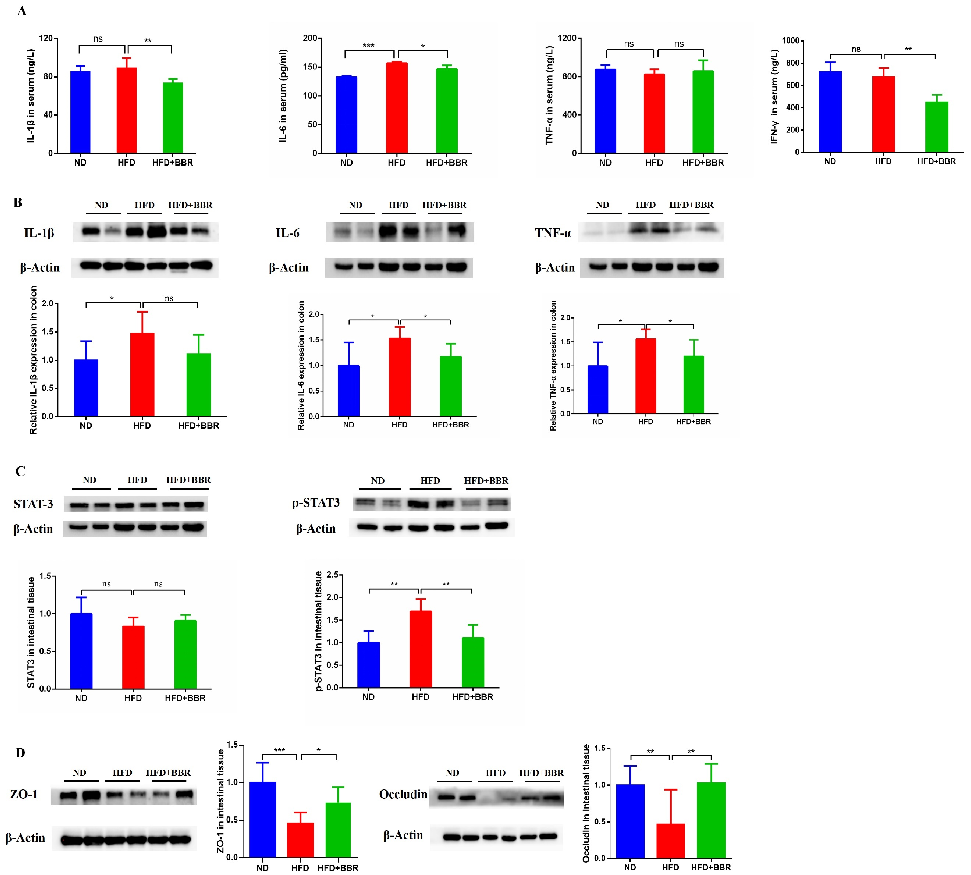
Lysophosphatidic acid signaling pathway components are quantified in colonic tissue. Berberine treatment is associated with downregulation of key enzymes in this pathway, suggesting a mechanism for its anti-tumor effects.
Berberine inhibits high fat diet-associated colorectal cancer through modulation of the gut …

Metabolomic profiling of gut contents identifies lysophosphatidic acid and related lipid metabolites altered by berberine supplementation. Reduced levels of pro-tumorigenic lipids correlate with tumor suppression.
Berberine inhibits high fat diet-associated colorectal cancer through modulation of the gut …
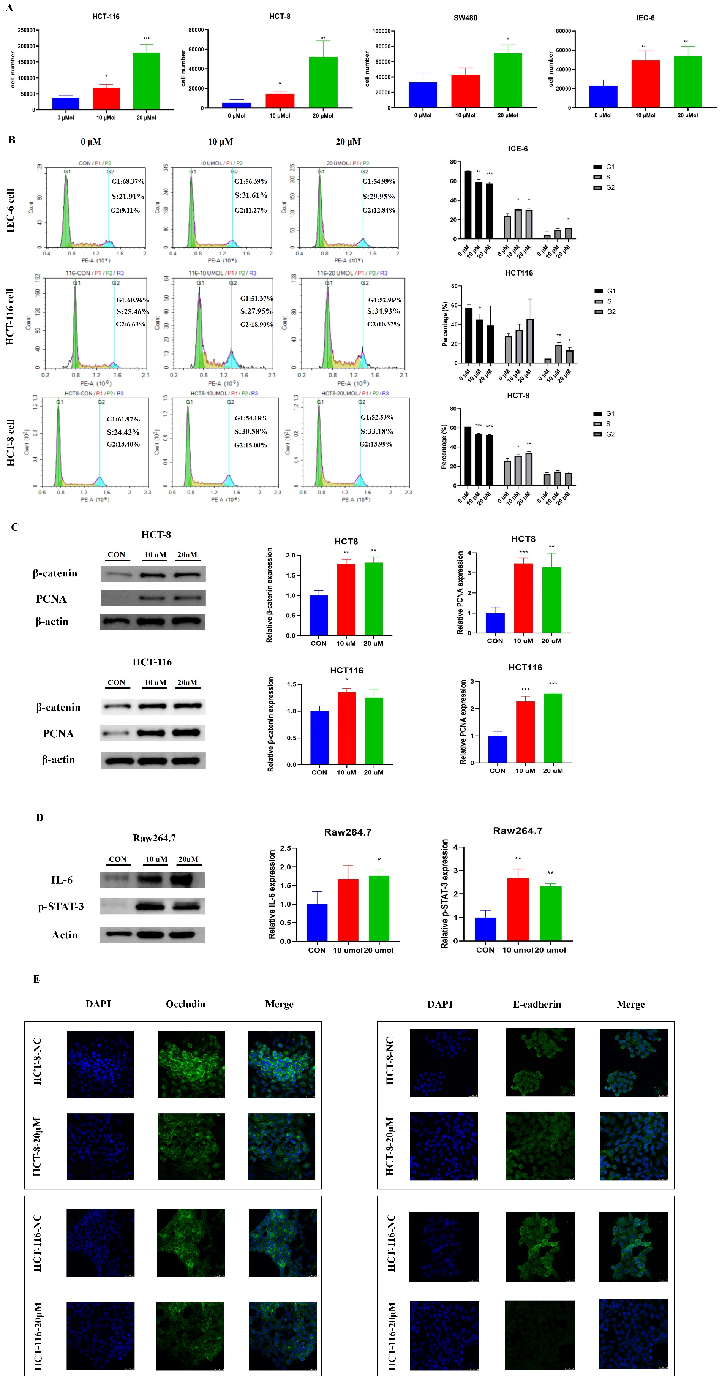
Western blot analysis demonstrates changes in protein expression of key signaling molecules in the lysophosphatidic acid pathway following berberine treatment. Reduced phosphorylation of downstream targets indicates pathway inhibition.
Berberine inhibits high fat diet-associated colorectal cancer through modulation of the gut …
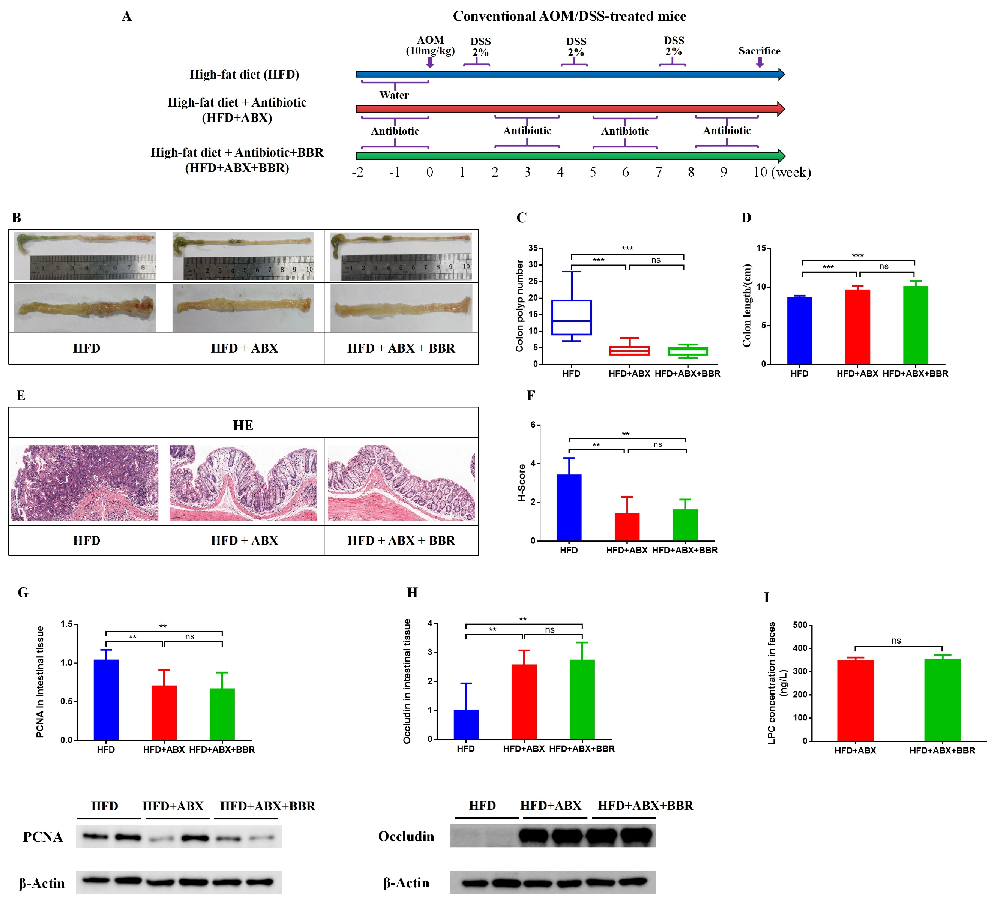
Fecal microbiota transplantation experiments confirm the role of gut microbiota in mediating berberine's anti-tumor effects. Mice receiving microbiota from berberine-treated donors showed reduced tumor development.
Berberine inhibits high fat diet-associated colorectal cancer through modulation of the gut …
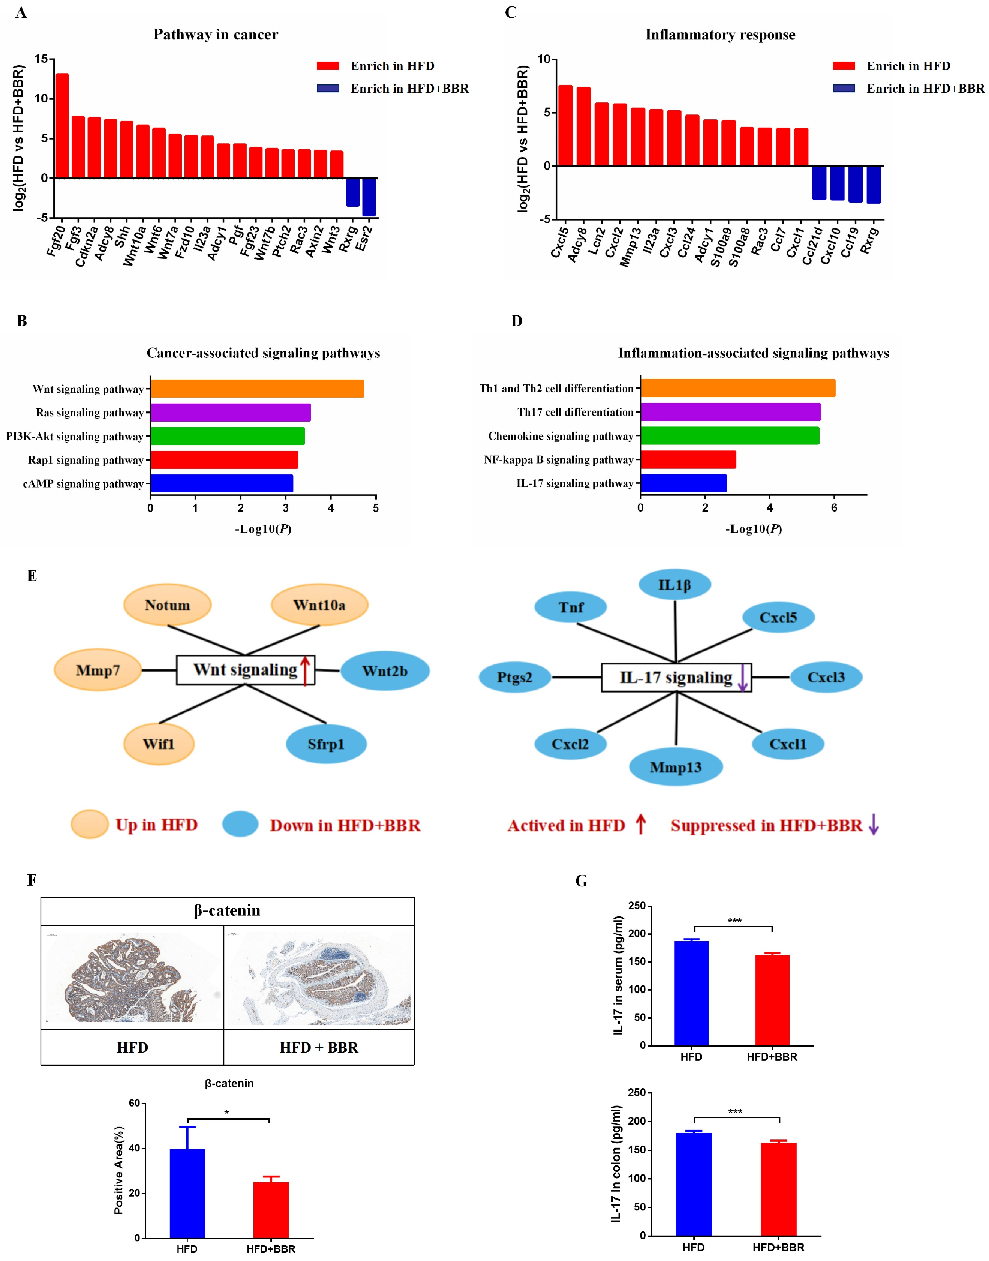
Correlation analysis between gut microbial abundance and lysophosphatidic acid levels identifies specific bacterial species linked to metabolite production. Berberine's microbiome modulation appears to reduce cancer-promoting metabolites.
Berberine inhibits high fat diet-associated colorectal cancer through modulation of the gut …
Immune cell infiltration in colonic tumors is assessed across treatment groups. Berberine supplementation is associated with increased anti-tumor immune responses and reduced immunosuppressive cell populations.
Berberine inhibits high fat diet-associated colorectal cancer through modulation of the gut …
A proposed mechanistic model illustrates how berberine inhibits high-fat diet-associated colorectal cancer through gut microbiota remodeling, reduced lysophosphatidic acid production, and modulation of downstream oncogenic signaling.
Berberine inhibits high fat diet-associated colorectal cancer through modulation of the gut …
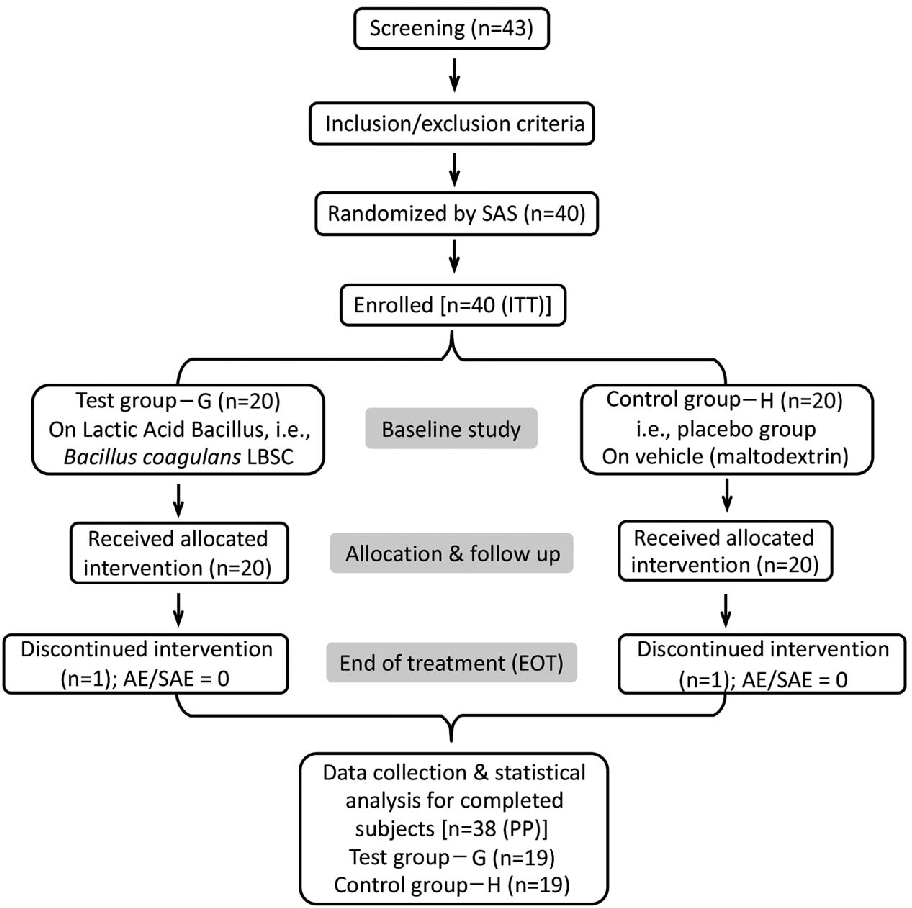
Total IBS symptom scores decrease significantly in the Bacillus coagulans LBSC group compared to placebo over the treatment period. Both bloating and abdominal pain subscores show improvement.
Efficacy and safety of Bacillus coagulans LBSC in irritable bowel syndrome: A …
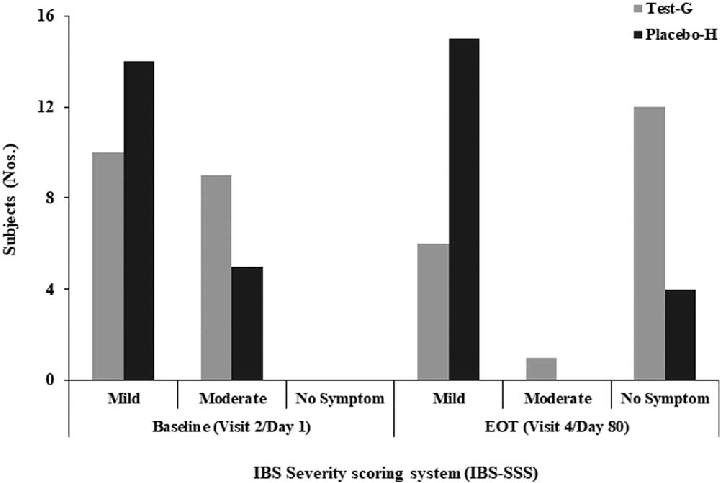
Individual IBS symptom domains including bloating, abdominal pain, urgency, and incomplete evacuation are tracked across study visits. Bacillus coagulans supplementation shows benefits across multiple symptom dimensions.
Efficacy and safety of Bacillus coagulans LBSC in irritable bowel syndrome: A …
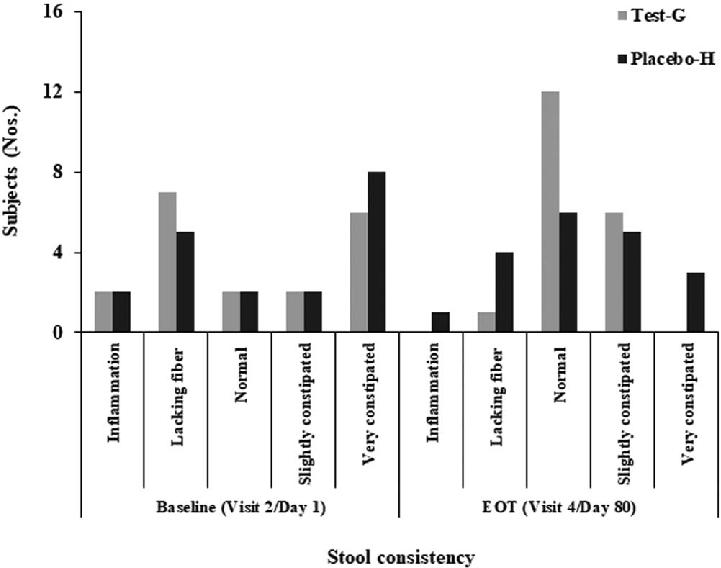
Stool consistency changes from baseline to end of treatment are assessed using the Bristol Stool Form Scale. The Bacillus coagulans group shows normalization toward type 3-4 stools compared to placebo.
Efficacy and safety of Bacillus coagulans LBSC in irritable bowel syndrome: A …
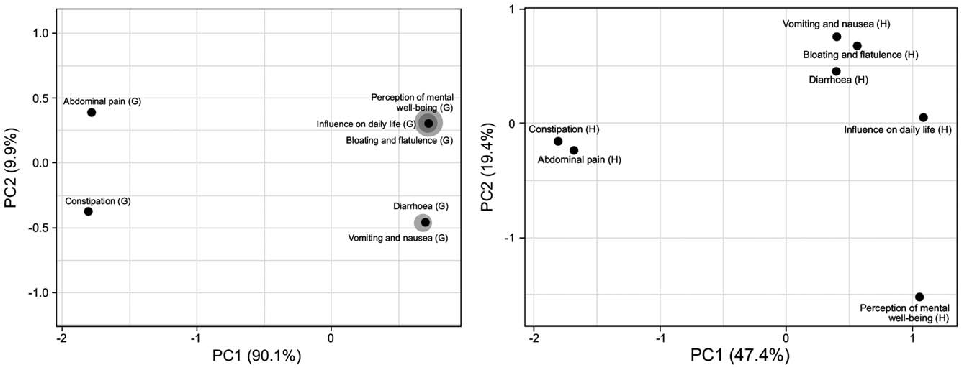
Principal component analysis of quality of life responses clusters patients by treatment arm. Bacillus coagulans-treated patients show greater separation from baseline values, indicating improved quality of life dimensions.
Efficacy and safety of Bacillus coagulans LBSC in irritable bowel syndrome: A …
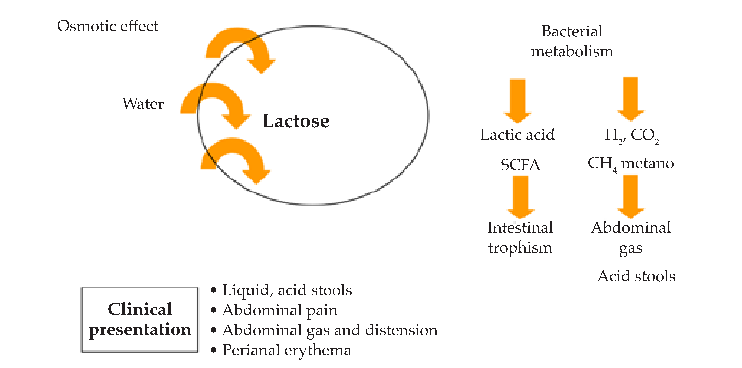
Pathophysiology of lactose intolerance illustrating how undigested lactose causes symptoms through osmotic effects in the intestinal lumen and bacterial fermentation producing hydrogen, carbon dioxide, and methane gases.
Lactose intolerance: myths and facts. An update.
Diagnostic algorithm or classification scheme for lactose intolerance, distinguishing between primary (genetic), secondary (disease-related), and congenital forms of lactase deficiency.
Lactose intolerance: myths and facts. An update.
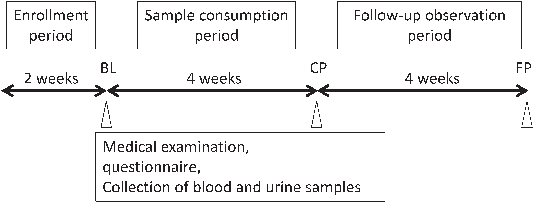
Study protocol timeline for the trial evaluating continuous consumption of fermented milk containing Bifidobacterium bifidum YIT 10347 in patients with functional gastrointestinal symptoms.
Continuous consumption of fermented milk containing Bifidobacterium bifidum YIT 10347 improves gastrointestinal …
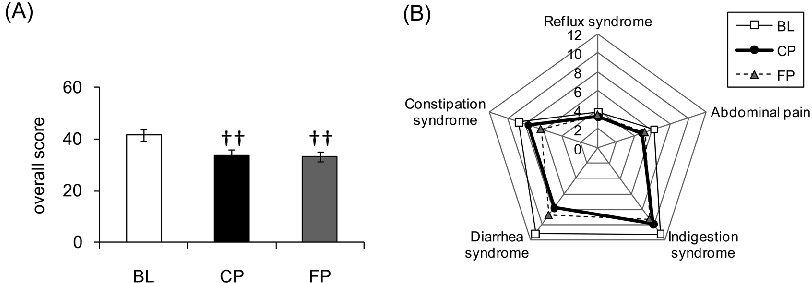
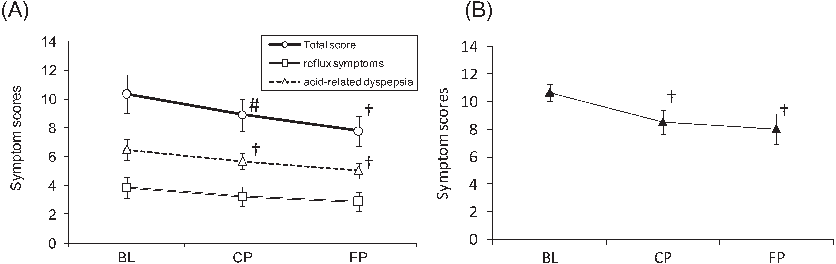
Gastrointestinal symptom scores over time in patients consuming Bifidobacterium bifidum YIT 10347-containing fermented milk, tracking improvements in dyspepsia and related complaints.
Continuous consumption of fermented milk containing Bifidobacterium bifidum YIT 10347 improves gastrointestinal …
Psychological symptom assessments in patients with functional gastrointestinal disorders during the probiotic fermented milk intervention period.
Continuous consumption of fermented milk containing Bifidobacterium bifidum YIT 10347 improves gastrointestinal …
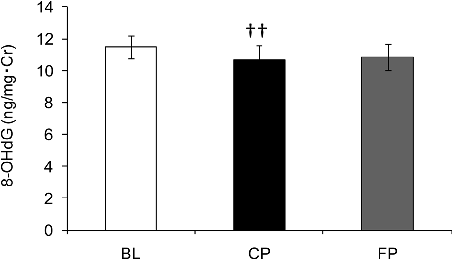
Urinary 8-hydroxy-2'-deoxyguanosine (8-OHdG) concentration changes over time, reflecting oxidative stress levels during Bifidobacterium bifidum YIT 10347 supplementation.
Continuous consumption of fermented milk containing Bifidobacterium bifidum YIT 10347 improves gastrointestinal …
Page 8 sur 20