Vitamin A 图表
13 来自同行评审研究的图表
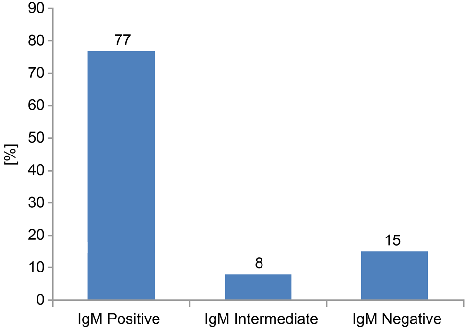
Fig. 1. The overall distribution of anti-measles antibody (IgM) in patients’ sera (n = 100).
The Resurgence of Measles Infection and its Associated Complications in Early Childhood …
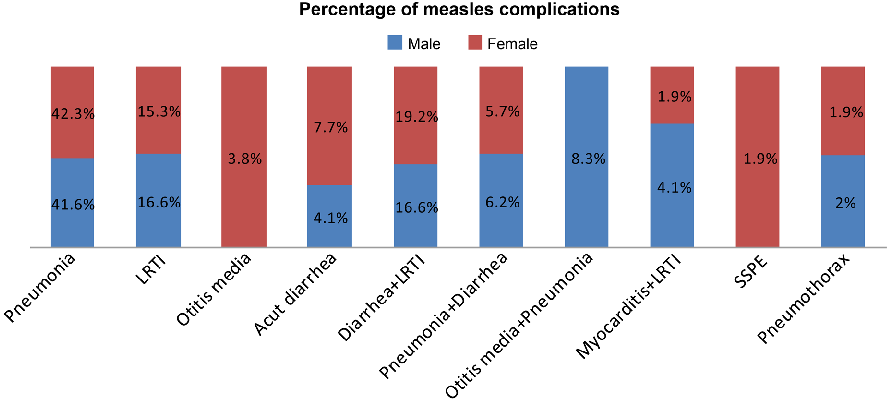
Fig. 2. Gender distribution of measles complications (Percentage).
The Resurgence of Measles Infection and its Associated Complications in Early Childhood …
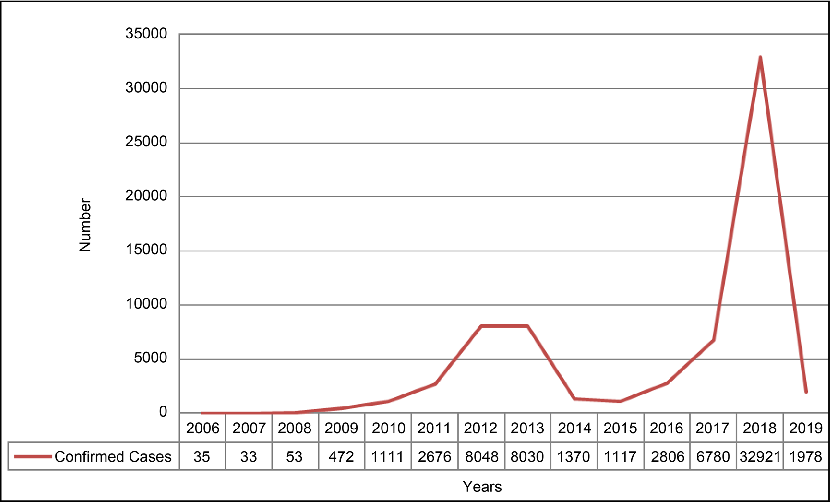
Fig. 3. Number of confirmed measles cases from 2006 to 2019 in Pakistan (WHO 2019; updates).
The Resurgence of Measles Infection and its Associated Complications in Early Childhood …
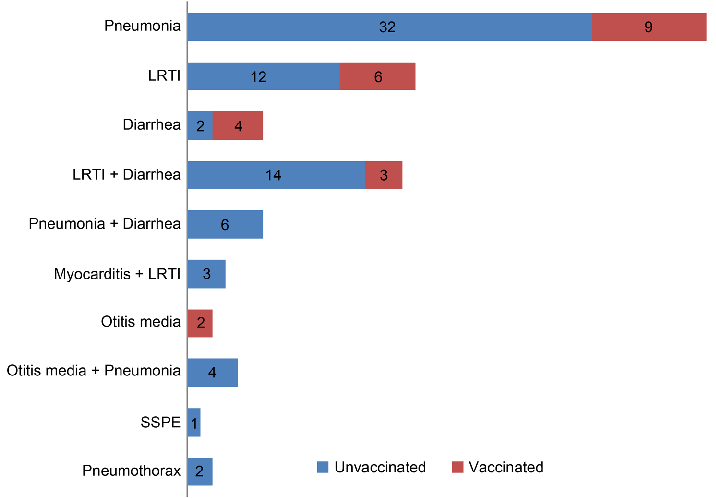
Fig. 4. Distribution of measles complications among measles-vaccinated and unvaccinated children.
The Resurgence of Measles Infection and its Associated Complications in Early Childhood …
Body weight trajectories and metabolic parameters are compared between vitamin A-sufficient and vitamin A-deficient mice over the study period.
Changes in Intestinal Microbiota Are Associated with Islet Function in a Mouse …
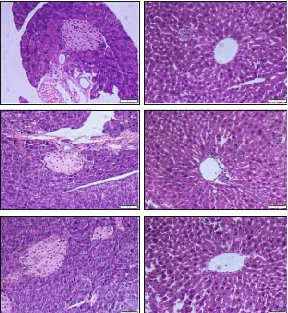
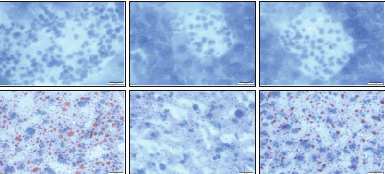
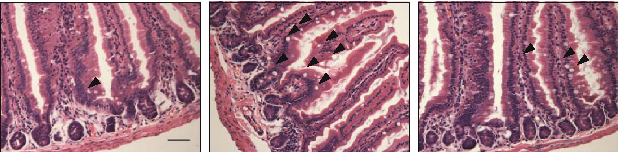
Histological examination of pancreatic and hepatic tissue compares morphological changes between vitamin A-sufficient and deficient mice.
Changes in Intestinal Microbiota Are Associated with Islet Function in a Mouse …
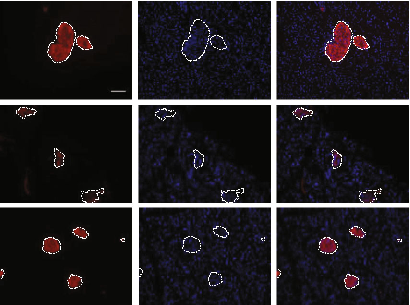
Immunofluorescence staining for insulin and DAPI in pancreatic islets reveals altered islet architecture and reduced insulin-positive area in vitamin A-deficient mice.
Changes in Intestinal Microbiota Are Associated with Islet Function in a Mouse …
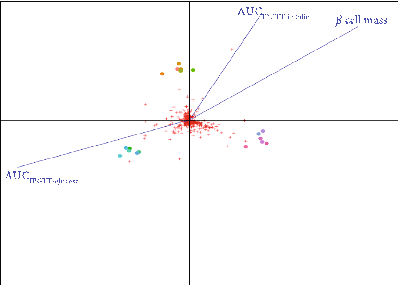
Correlation heatmap links specific gut bacterial taxa to measures of islet function and glucose homeostasis, suggesting microbiota-mediated effects on pancreatic health.
Changes in Intestinal Microbiota Are Associated with Islet Function in a Mouse …
Comparison of gut microbiota composition across vitamin A-sufficient, deficient, and diet-repleted groups demonstrates partial restoration of microbial communities after vitamin A repletion.
Changes in Intestinal Microbiota Are Associated with Islet Function in a Mouse …
Functional prediction analysis of gut microbiota identifies metabolic pathways altered by vitamin A deficiency that may impact islet cell function.
Changes in Intestinal Microbiota Are Associated with Islet Function in a Mouse …
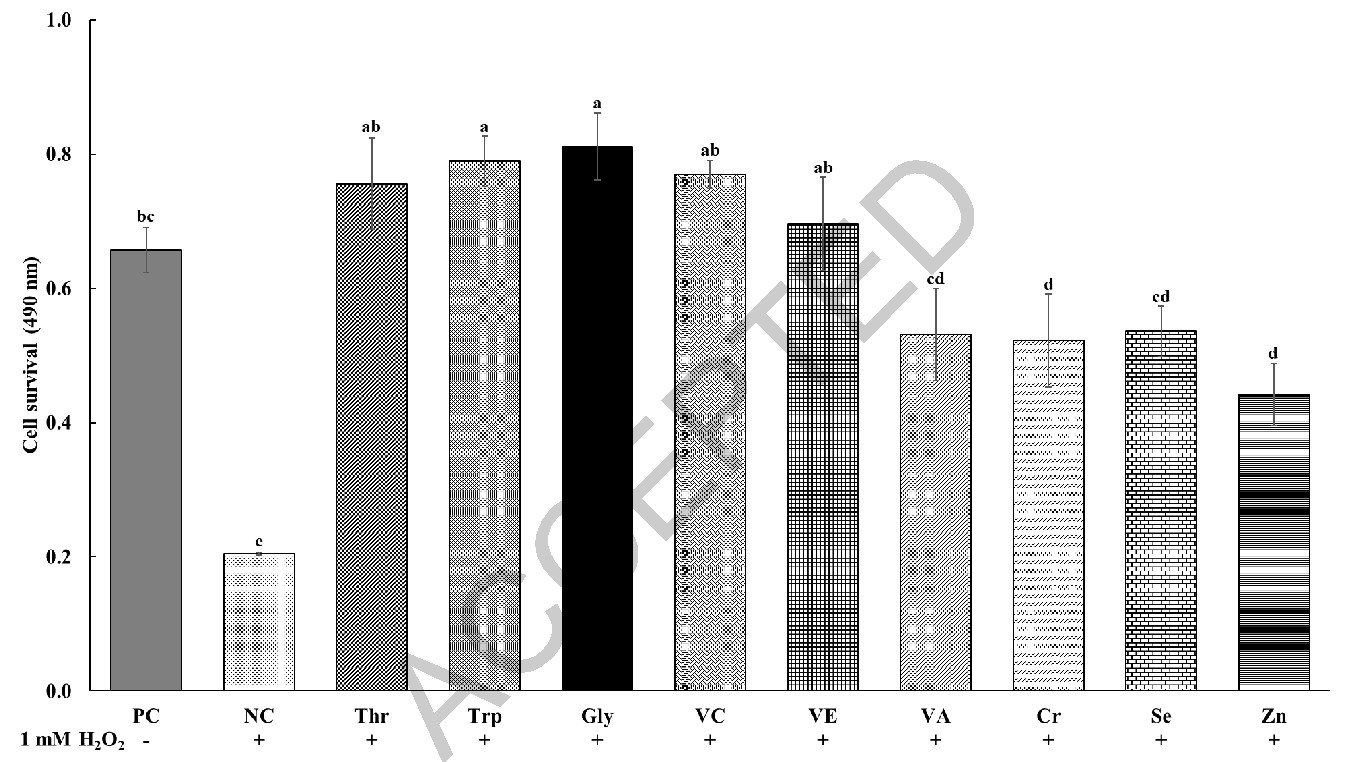
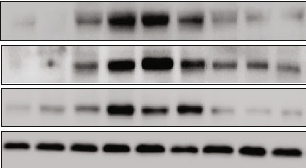
Effects of functional nutrients on chicken intestinal epithelial cells induced with oxidative …
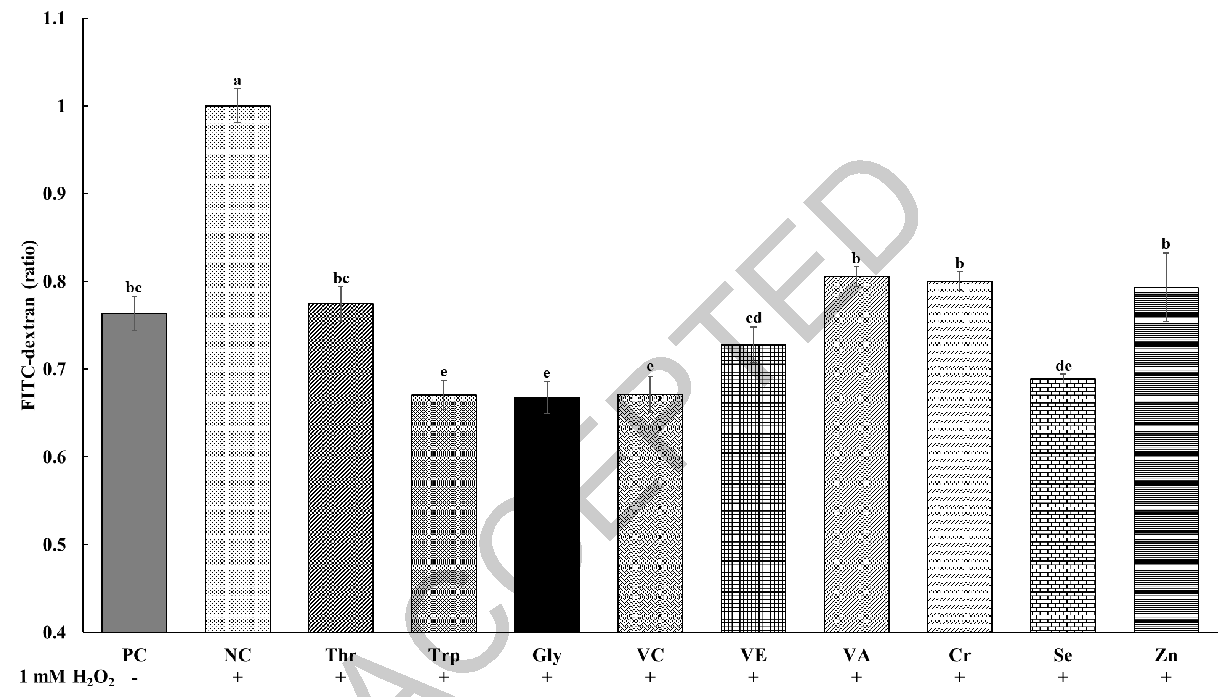
Effects of functional nutrients on chicken intestinal epithelial cells induced with oxidative …
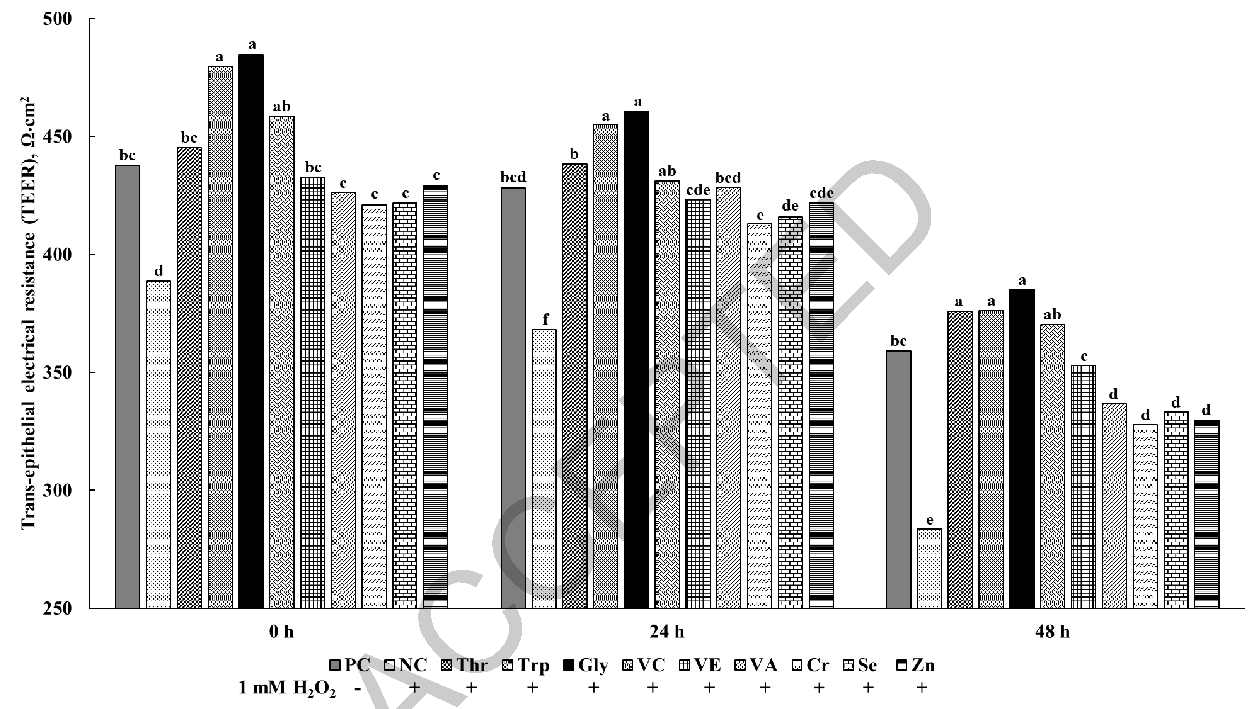
Effects of functional nutrients on chicken intestinal epithelial cells induced with oxidative …