研究流程
15 来自同行评审研究的图表
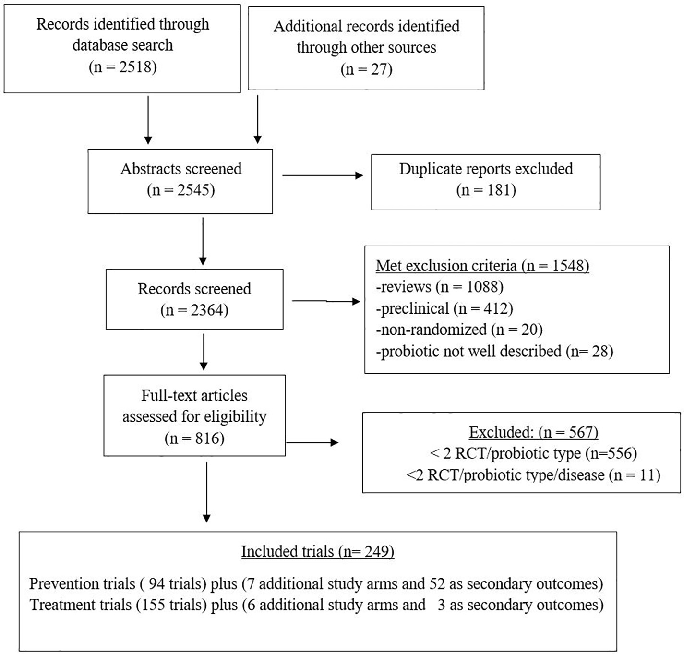
A PRISMA flow diagram details the systematic literature search and study selection process for evaluating probiotic efficacy across multiple clinical conditions. Studies are screened from inception through defined databases with specific inclusion and exclusion criteria.
Choosing an appropriate probiotic product for your patient: An evidence-based practical guide.
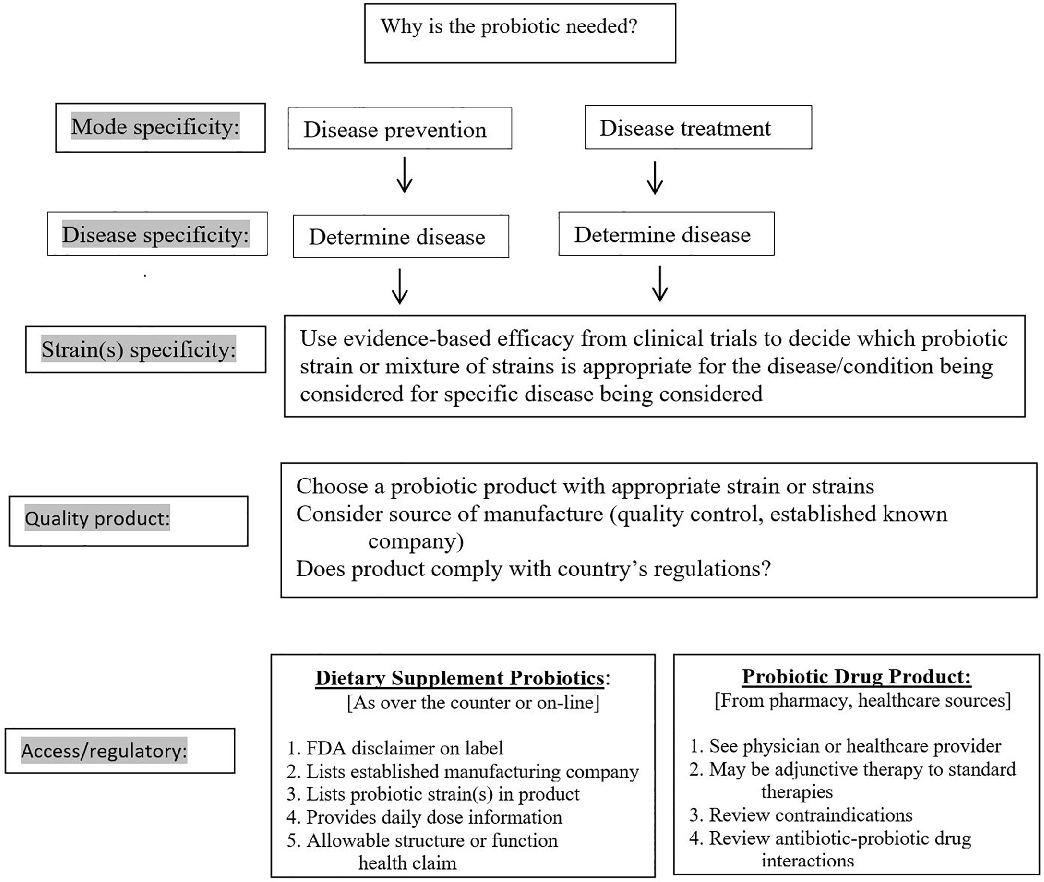
A clinical decision algorithm guides clinicians through the process of selecting an appropriate probiotic product based on the patient's specific condition, available evidence for particular strains, and practical considerations such as product availability and cost.
Choosing an appropriate probiotic product for your patient: An evidence-based practical guide.
Diagnostic criteria for IBS rely on symptom-based assessment using Rome IV criteria, with limited use of diagnostic tests. Serological screening for celiac disease is recommended as part of the initial evaluation.
Canadian Association of Gastroenterology Clinical Practice Guideline for the Management of Irritable …
An algorithmic approach to IBS management stratifies treatment by predominant bowel habit (IBS-C, IBS-D, IBS-M) and symptom severity. First-line interventions include dietary modification and fiber supplementation.
Canadian Association of Gastroenterology Clinical Practice Guideline for the Management of Irritable …
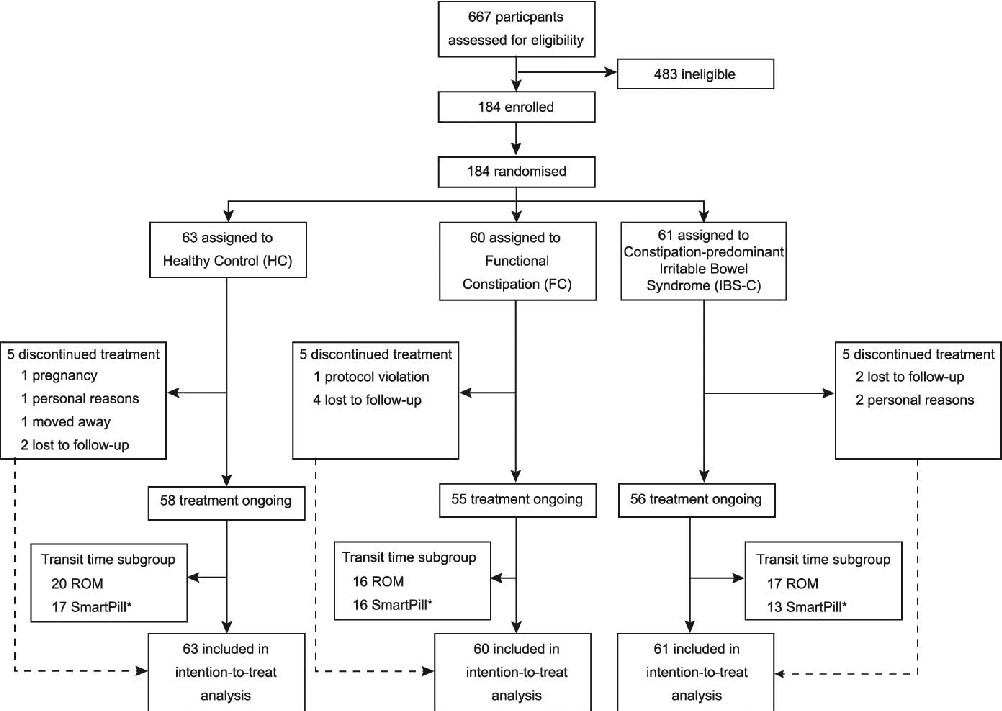
A double-blinded randomized placebo trial evaluated dietary fiber and probiotic formulas for functional constipation. This figure presents the study design, participant flow, or clinical outcomes showing how fiber and probiotic interventions modulated constipation symptoms and gut microbiota.
Effects of dietary fibers or probiotics on functional constipation symptoms and roles …
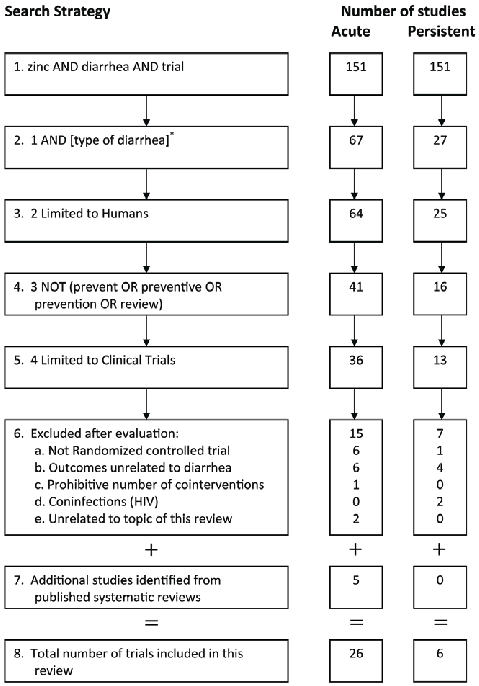
A PRISMA-style flowchart details the study selection protocol for this systematic review of zinc supplementation in diarrhea, showing the screening and inclusion criteria applied to identify eligible trials.
Therapeutic value of zinc supplementation in acute and persistent diarrhea: a systematic …
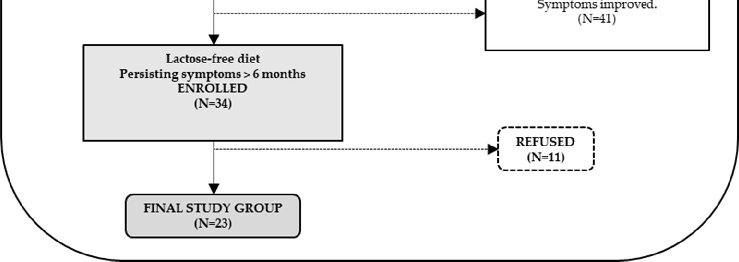
A CONSORT flow chart traces patient screening and enrollment for this trial of Bifidobacterium longum and Lactobacillus rhamnosus in lactose-intolerant individuals, detailing exclusions for organic diseases and final group assignments.
Effects of Bifidobacterium longum and Lactobacillus rhamnosus on Gut Microbiota in Patients …
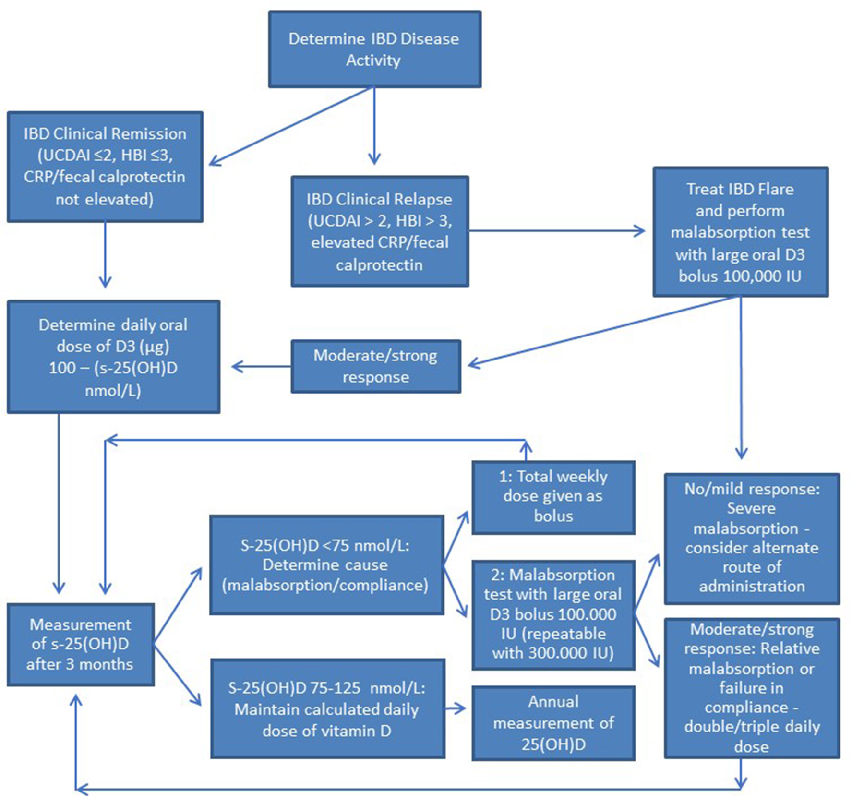
Clinical algorithm for vitamin D supplementation in IBD patients, showing dose calculation based on target 25(OH)D levels, escalation to weekly bolus if targets are unmet, and malabsorption workup considerations.
Managing vitamin D deficiency in inflammatory bowel disease.
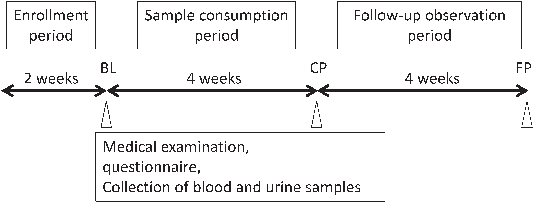
Study protocol timeline for the trial evaluating continuous consumption of fermented milk containing Bifidobacterium bifidum YIT 10347 in patients with functional gastrointestinal symptoms.
Continuous consumption of fermented milk containing Bifidobacterium bifidum YIT 10347 improves gastrointestinal …
CONSORT flow diagram for the multicenter RCT evaluating green kiwifruit consumption for constipation relief, detailing participant screening, randomization, and follow-up stages.
Consumption of 2 Green Kiwifruits Daily Improves Constipation and Abdominal Comfort-Results of …
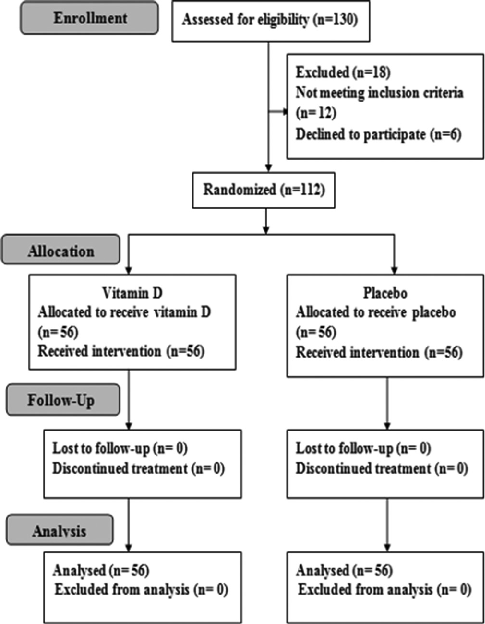
Flow chart of the randomized controlled trial evaluating vitamin D supplementation in adolescents with IBS, detailing patient screening, randomization, intervention, and outcome assessment stages.
Vitamin D supplementation in adolescents with irritable bowel syndrome: Is it useful? …
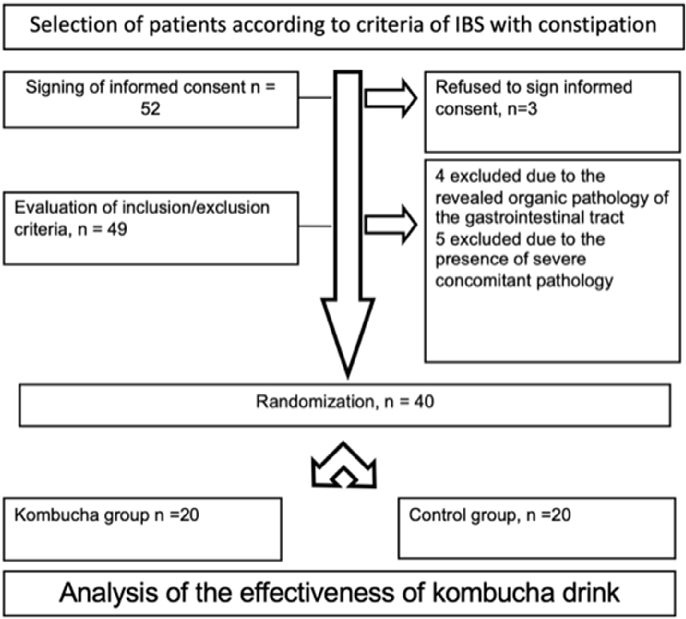
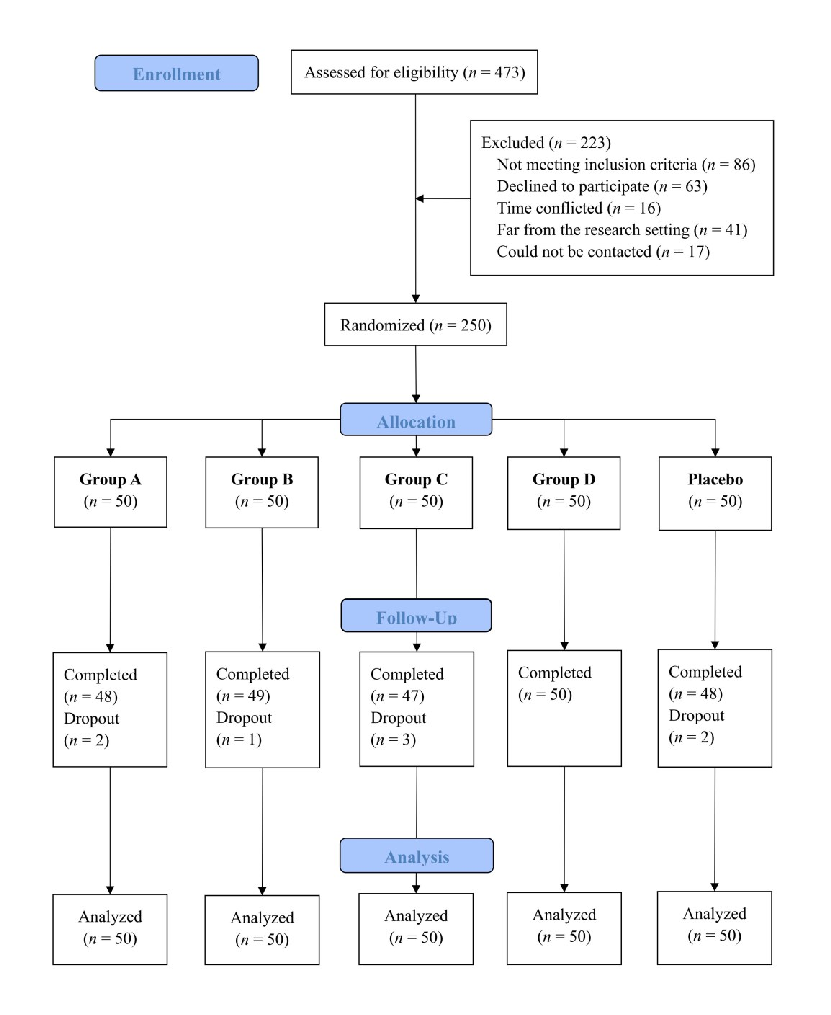
CONSORT flow diagram detailing patient enrollment, randomization, allocation to treatment and control groups, and final analysis in the IBS-C kombucha intervention trial. Dropout rates and reasons for exclusion are documented at each stage.
Evaluation of the Efficacy of Kombucha-Based Drink Enriched with Inulin and Vitamins …
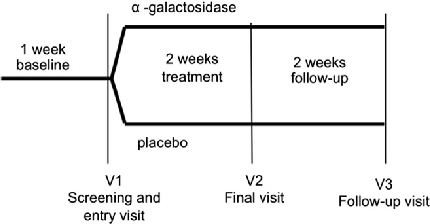
Participant enrollment and randomization flow for the double-blind trial evaluating α-galactosidase in children with gas-related symptoms is depicted.
Efficacy and tolerability of α-galactosidase in treating gas-related symptoms in children: a …
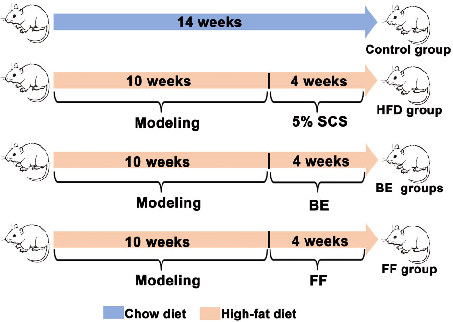
The experimental design outlines the group allocation including sodium carboxymethyl cellulose control, berberine-evodiamine combination, and fenofibrate positive control arms.
The combination of berberine and evodiamine ameliorates high-fat diet-induced non-alcoholic fatty liver …
![Figure 1.Figure 1.The flowchart figure was drawn according to the statement of the PRISMA protocol [36].The flowchart figure was drawn according to the statement of the PRISMA protocol [36].](https://pdfs.citedhealth.com/figures/35745242/196.png)
PRISMA flowchart depicting the systematic literature search and study selection process for the review of bovine colostrum supplementation effects on leaky gut syndrome in athletes.
A Systematic Review of the Influence of Bovine Colostrum Supplementation on Leaky …