अनुसंधान प्रक्रिया
477 सहकर्मी-समीक्षित शोध से आंकड़े
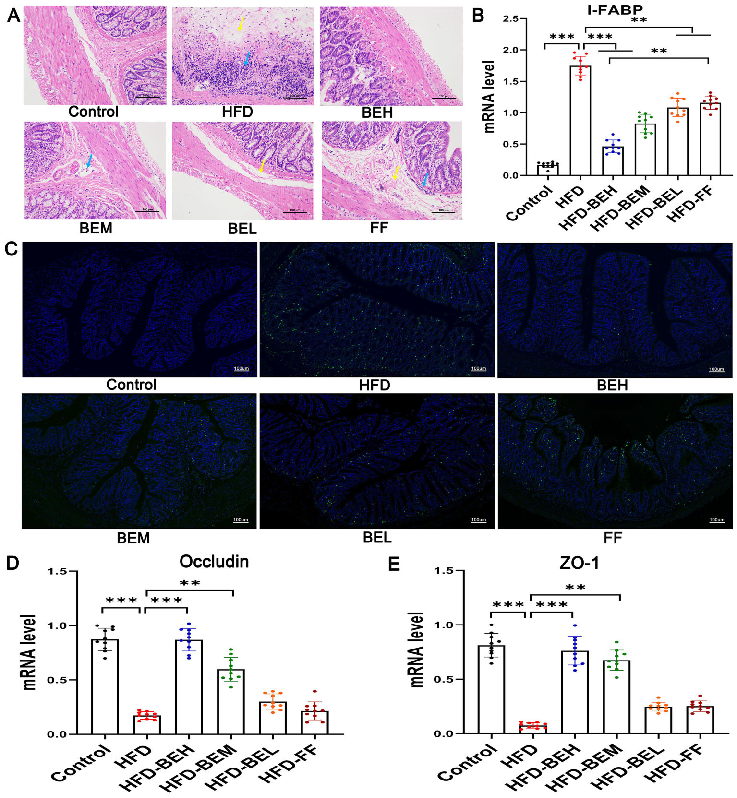
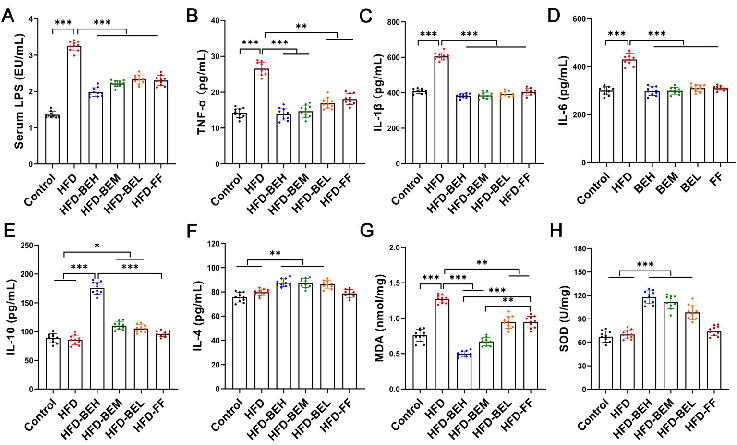
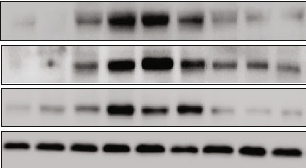
Short-chain fatty acid concentrations in fecal samples reflect changes in microbial metabolic activity following berberine and evodiamine treatment.
The combination of berberine and evodiamine ameliorates high-fat diet-induced non-alcoholic fatty liver …
Correlation analysis between gut microbiota composition and hepatic lipid parameters links specific bacterial taxa to the amelioration of non-alcoholic fatty liver disease.
The combination of berberine and evodiamine ameliorates high-fat diet-induced non-alcoholic fatty liver …
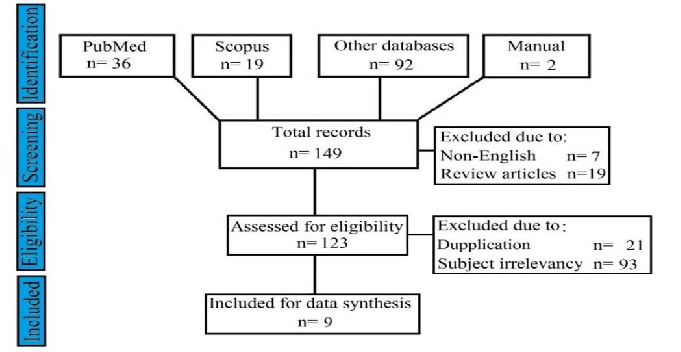
Fig. 1: Schematic diagram of article selection
Turmeric for Treatment of Irritable Bowel Syndrome: A Systematic Review of Population-Based …
Body weight trajectories and metabolic parameters are compared between vitamin A-sufficient and vitamin A-deficient mice over the study period.
Changes in Intestinal Microbiota Are Associated with Islet Function in a Mouse …
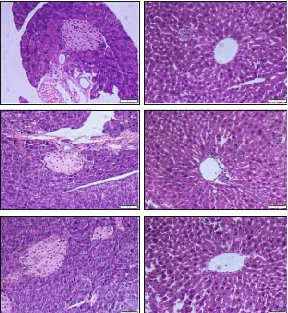
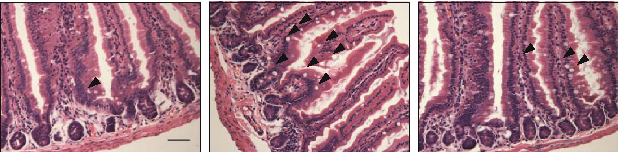
Histological examination of pancreatic and hepatic tissue compares morphological changes between vitamin A-sufficient and deficient mice.
Changes in Intestinal Microbiota Are Associated with Islet Function in a Mouse …
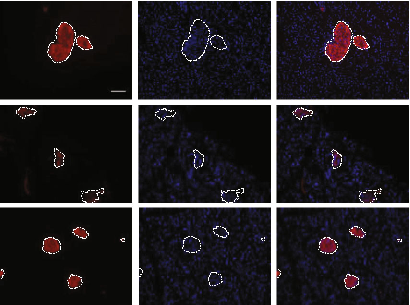
Immunofluorescence staining for insulin and DAPI in pancreatic islets reveals altered islet architecture and reduced insulin-positive area in vitamin A-deficient mice.
Changes in Intestinal Microbiota Are Associated with Islet Function in a Mouse …
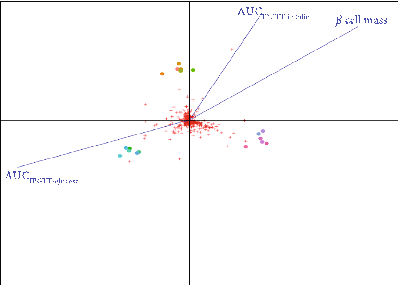
Correlation heatmap links specific gut bacterial taxa to measures of islet function and glucose homeostasis, suggesting microbiota-mediated effects on pancreatic health.
Changes in Intestinal Microbiota Are Associated with Islet Function in a Mouse …
Comparison of gut microbiota composition across vitamin A-sufficient, deficient, and diet-repleted groups demonstrates partial restoration of microbial communities after vitamin A repletion.
Changes in Intestinal Microbiota Are Associated with Islet Function in a Mouse …
Functional prediction analysis of gut microbiota identifies metabolic pathways altered by vitamin A deficiency that may impact islet cell function.
Changes in Intestinal Microbiota Are Associated with Islet Function in a Mouse …
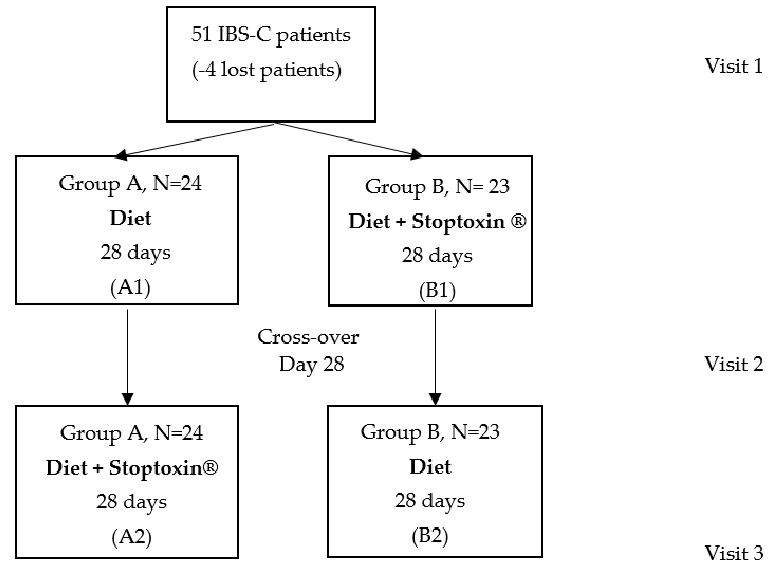
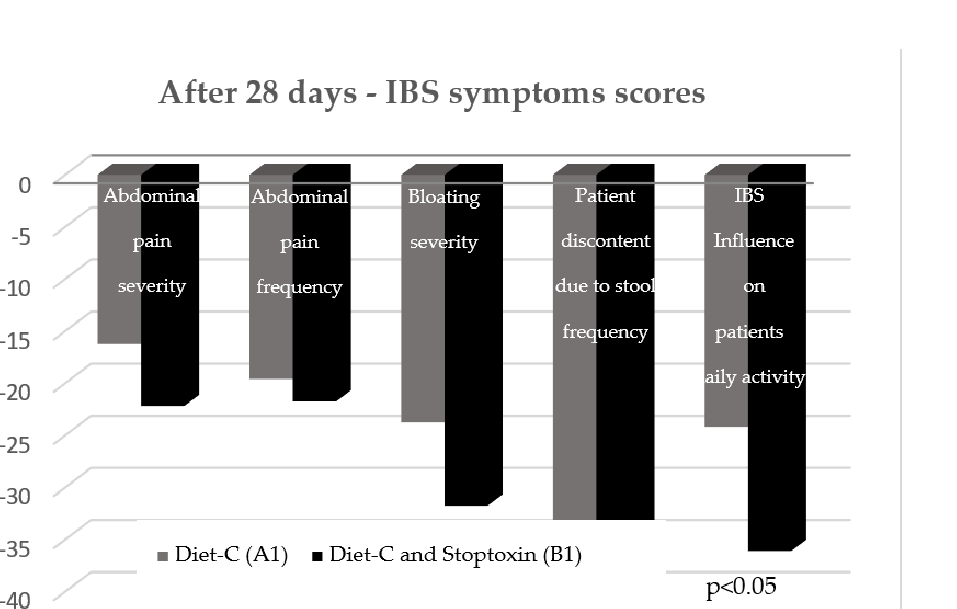
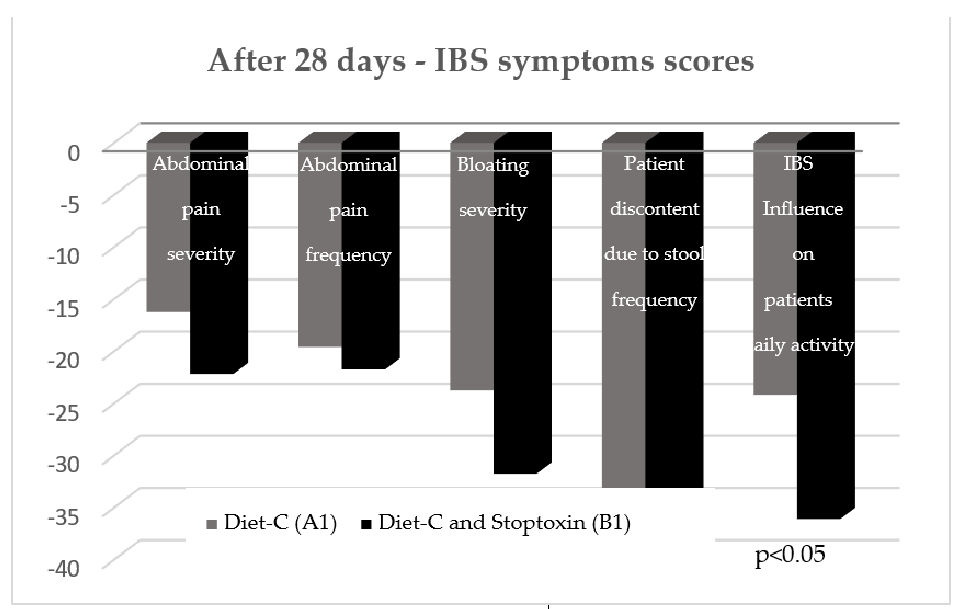
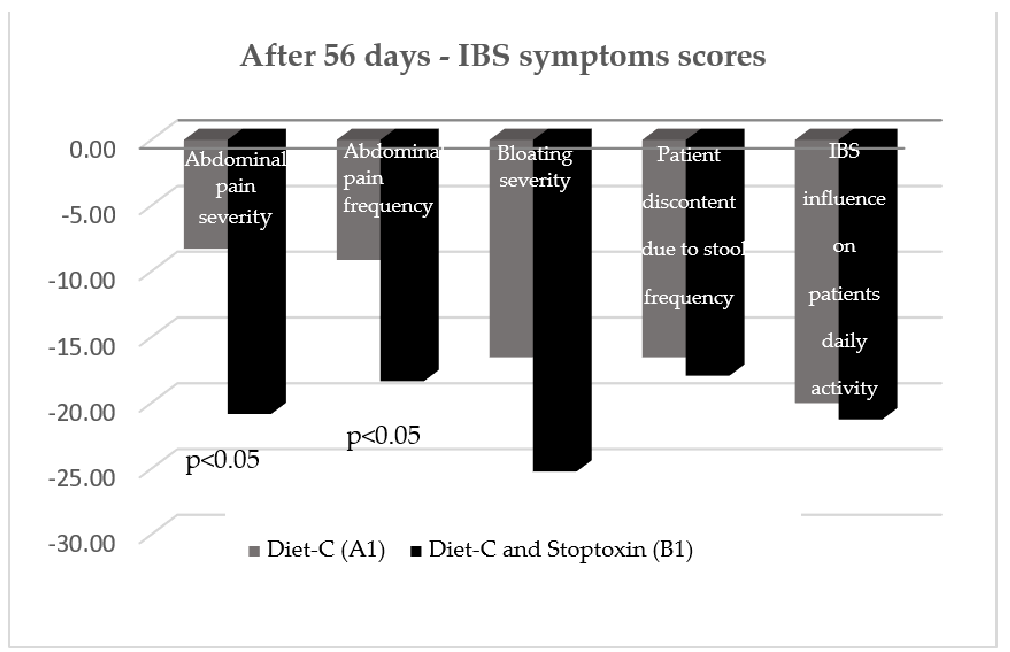
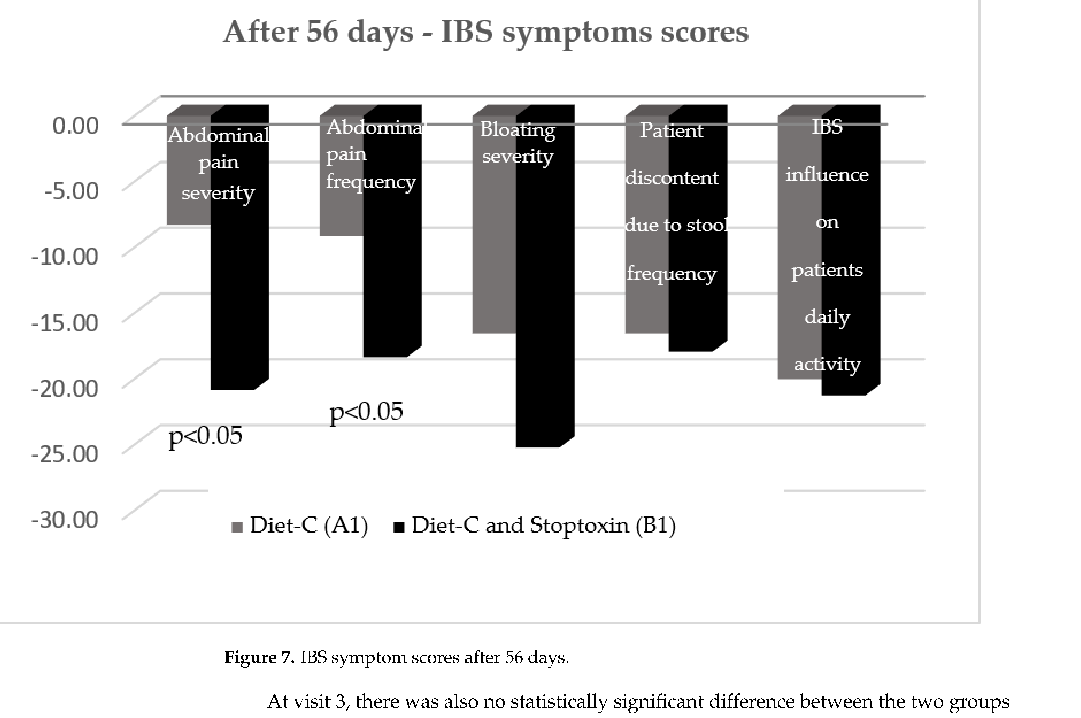
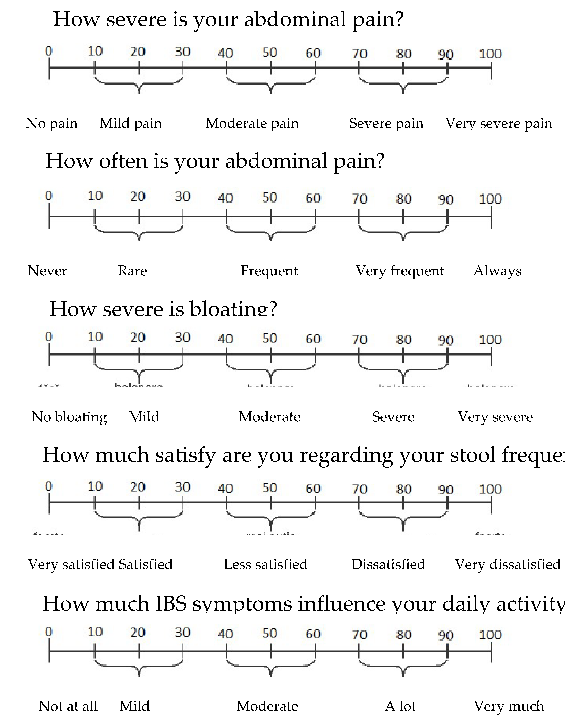
Comparative analysis of individual IBS symptom domains across treatment groups, evaluating the differential effects of the inulin-choline-silymarin supplement.
Inulin, Choline and Silymarin in the Treatment of Irritable Bowel Syndrome with …
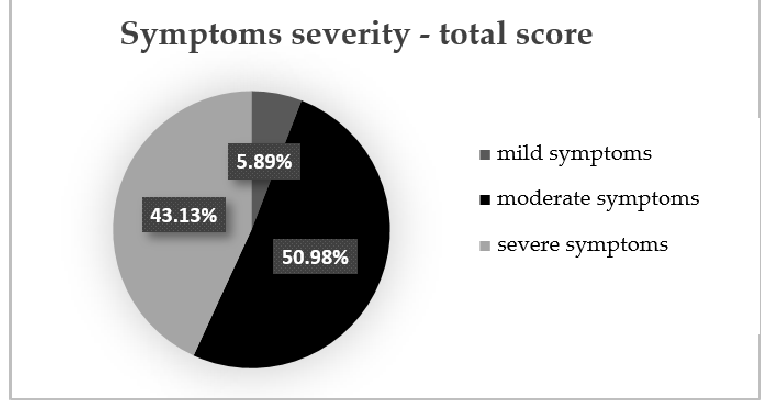
Symptom severity distribution at the initial evaluation, revealing that approximately half of the IBS-C patients presented with moderate symptoms while over 40% had severe manifestations.
Inulin, Choline and Silymarin in the Treatment of Irritable Bowel Syndrome with …
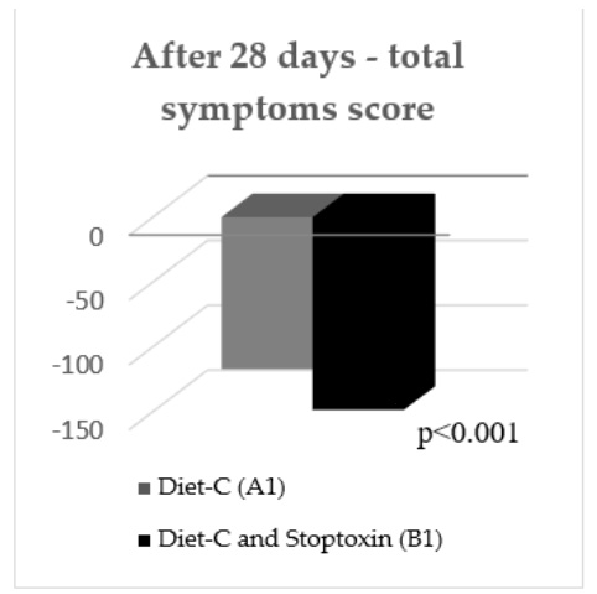
Total IBS symptom scores measured at the 28-day assessment point, comparing outcomes between the supplemented and control diet groups in the crossover design.
Inulin, Choline and Silymarin in the Treatment of Irritable Bowel Syndrome with …
Analysis of gastrointestinal symptom domains in the IBS-C study at an intermediate time point, tracking changes in bloating, pain, and bowel habit parameters.
Inulin, Choline and Silymarin in the Treatment of Irritable Bowel Syndrome with …
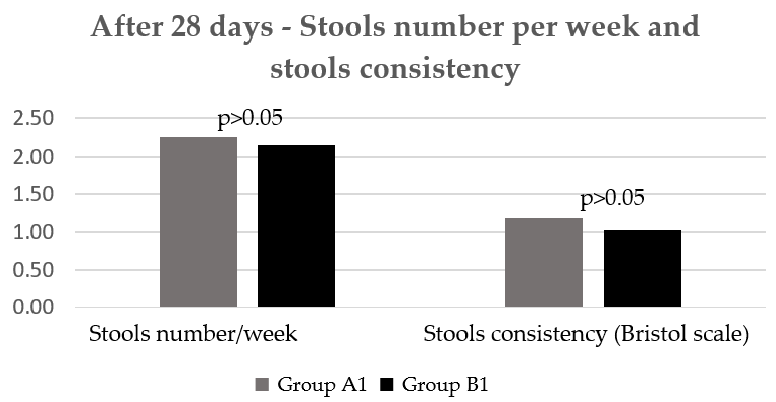
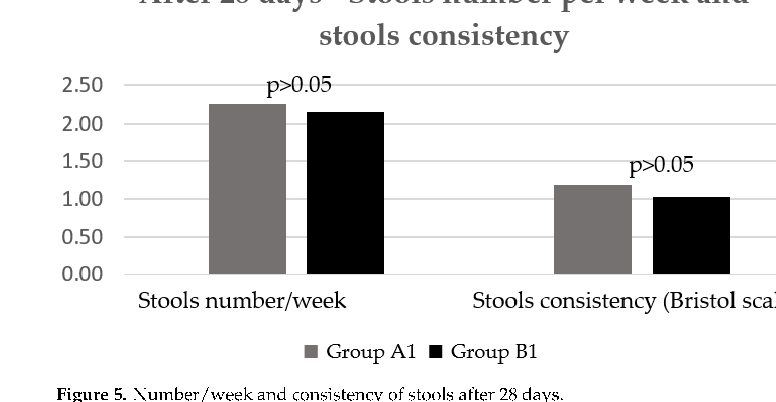
Stool frequency and consistency measurements during the treatment phase, evaluating whether inulin-based supplementation improved bowel regularity in IBS-C patients.
Inulin, Choline and Silymarin in the Treatment of Irritable Bowel Syndrome with …
Quality of life assessment data from IBS-C patients, comparing self-reported well-being between supplementation and control periods.
Inulin, Choline and Silymarin in the Treatment of Irritable Bowel Syndrome with …
Individual patient response trajectories over the treatment period, illustrating the variability in symptom improvement with the prebiotic supplement.
Inulin, Choline and Silymarin in the Treatment of Irritable Bowel Syndrome with …
Subgroup analysis of treatment response stratified by baseline symptom severity, exploring whether patients with severe IBS-C derived greater benefit from supplementation.
Inulin, Choline and Silymarin in the Treatment of Irritable Bowel Syndrome with …
Secondary endpoint analysis from the IBS-C trial, including measures of abdominal discomfort and transit time.
Inulin, Choline and Silymarin in the Treatment of Irritable Bowel Syndrome with …
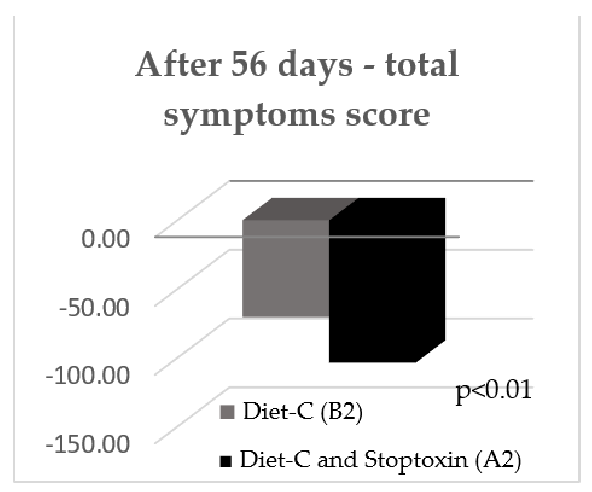
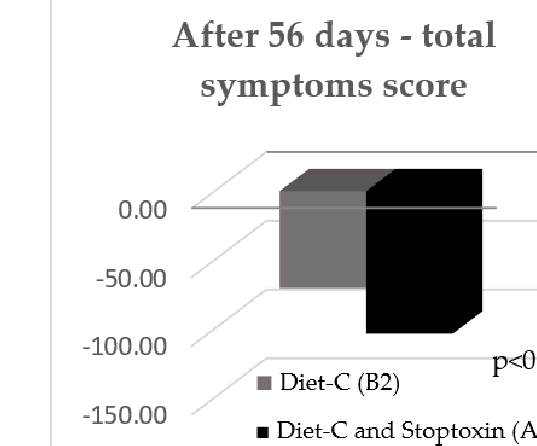
IBS symptom scores after 56 days of treatment, providing longer-term efficacy data for the inulin, choline, and silymarin supplementation regimen.
Inulin, Choline and Silymarin in the Treatment of Irritable Bowel Syndrome with …
Crossover period analysis comparing symptom trajectories when patients switched between the supplemented and unsupplemented diet phases.
Inulin, Choline and Silymarin in the Treatment of Irritable Bowel Syndrome with …
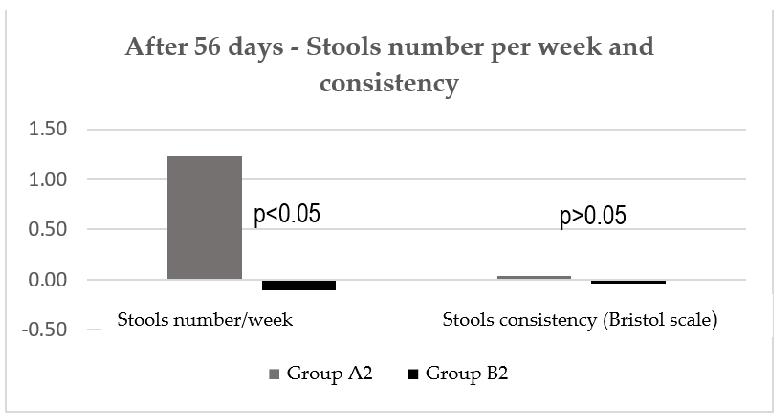
Stool frequency per week and stool consistency measurements after 56 days, indicating sustained effects of the prebiotic supplement on bowel function.
Inulin, Choline and Silymarin in the Treatment of Irritable Bowel Syndrome with …
Summary of adverse events or tolerability data from the IBS-C supplementation trial, documenting the safety profile of the inulin-choline-silymarin combination.
Inulin, Choline and Silymarin in the Treatment of Irritable Bowel Syndrome with …
![Figure 1.Figure 1.The flowchart figure was drawn according to the statement of the PRISMA protocol [36].The flowchart figure was drawn according to the statement of the PRISMA protocol [36].](https://pdfs.citedhealth.com/figures/35745242/196.png)
PRISMA flowchart depicting the systematic literature search and study selection process for the review of bovine colostrum supplementation effects on leaky gut syndrome in athletes.
A Systematic Review of the Influence of Bovine Colostrum Supplementation on Leaky …
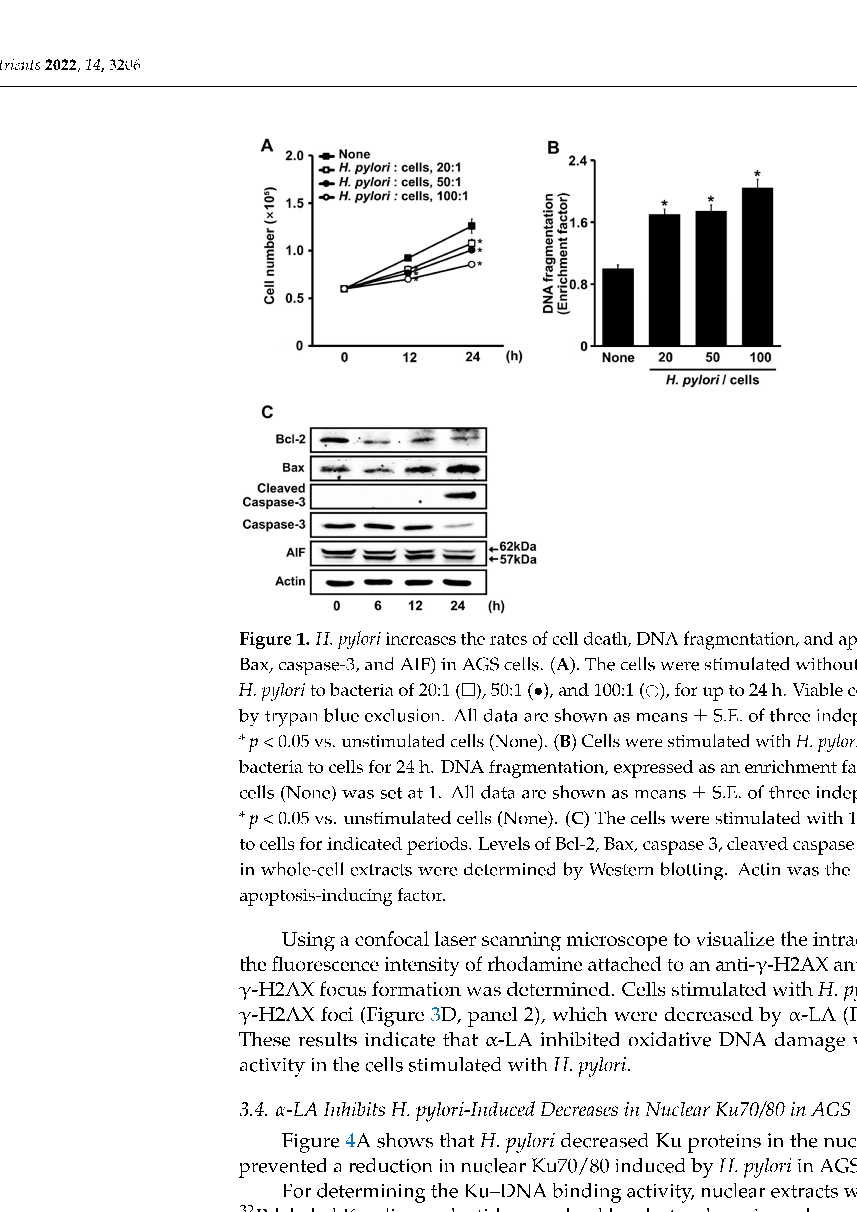
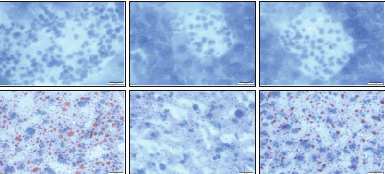
Immunofluorescence imaging of Ku70/Ku80 localization in gastric epithelial cells, showing nuclear protein retention in alpha-lipoic acid-treated cells despite H. pylori infection.
α-Lipoic Acid Inhibits Apoptosis by Suppressing the Loss of Ku Proteins in …
पृष्ठ 13 / 20