Research Figures
477 figures from peer-reviewed research
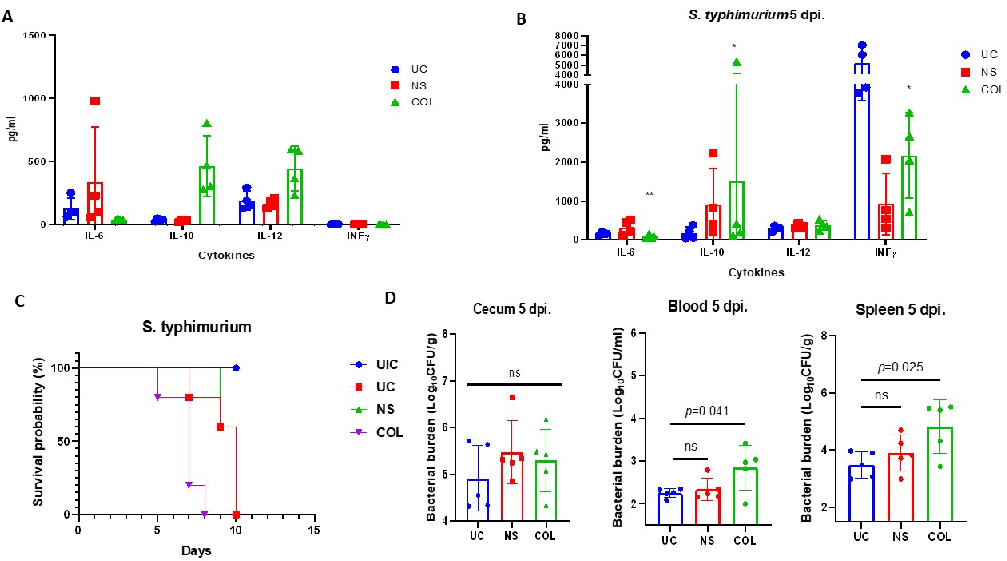
Statistical analysis from research investigating computational prediction of new therapeutic effects of probiotics, comparing treatment groups and control conditions.
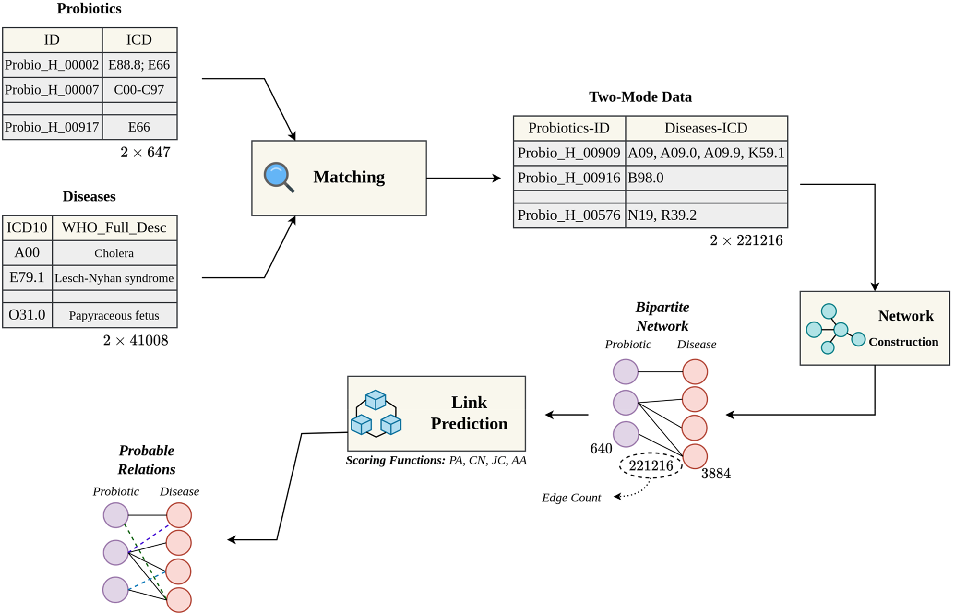
Computational prediction of new therapeutic effects of probiotics.
Measured parameters from a study evaluating computational prediction of new therapeutic effects of probiotics, contributing to the overall assessment of probiotics are living microorganisms that provide health benefits to their hosts, potentially aiding in the treatment.
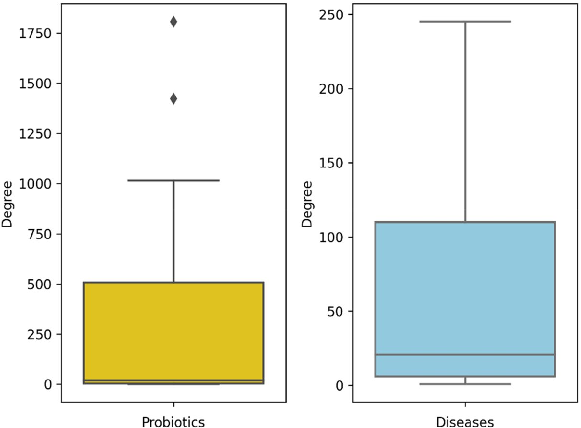
Computational prediction of new therapeutic effects of probiotics.
Graphical representation of outcomes in a study of computational prediction of new therapeutic effects of probiotics, highlighting trends observed across experimental conditions.
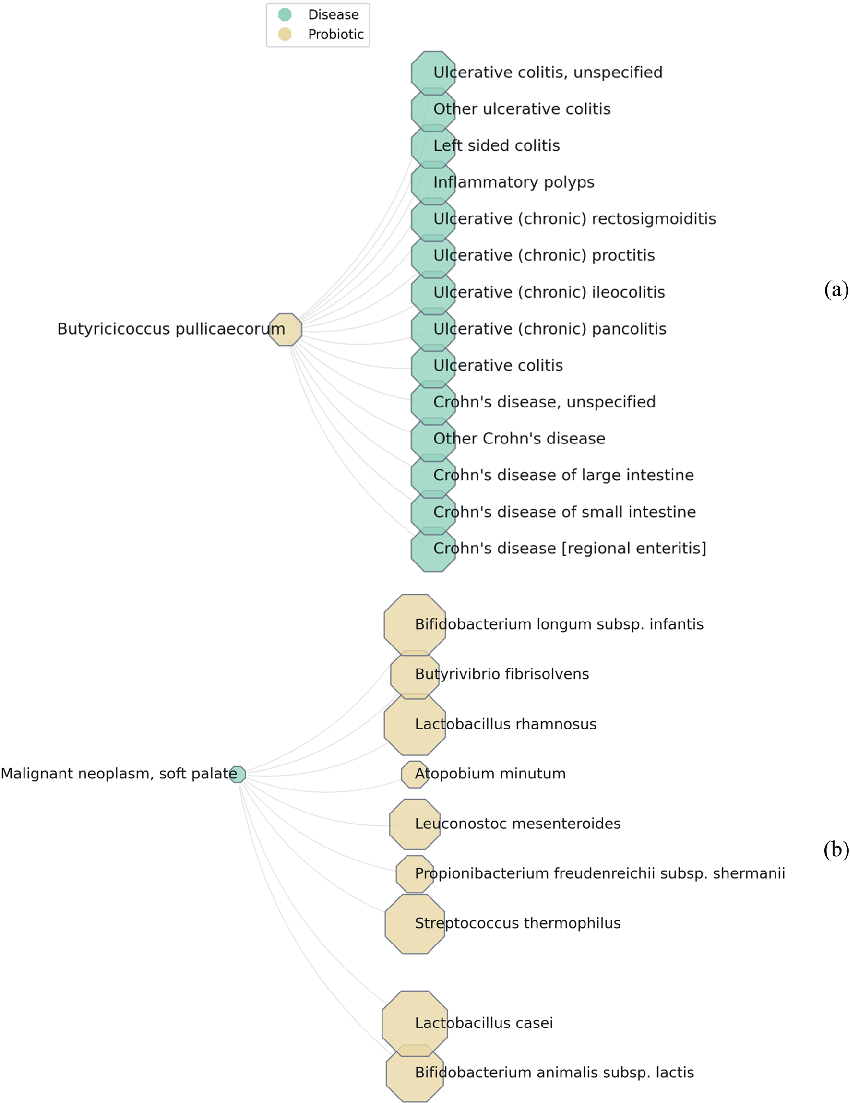
Computational prediction of new therapeutic effects of probiotics.
Quantitative data from a study on computational prediction of new therapeutic effects of probiotics, presenting measured outcomes relevant to the investigation of probiotics are living microorganisms that provide health benefits to their hosts, potentially aiding in the treatment.
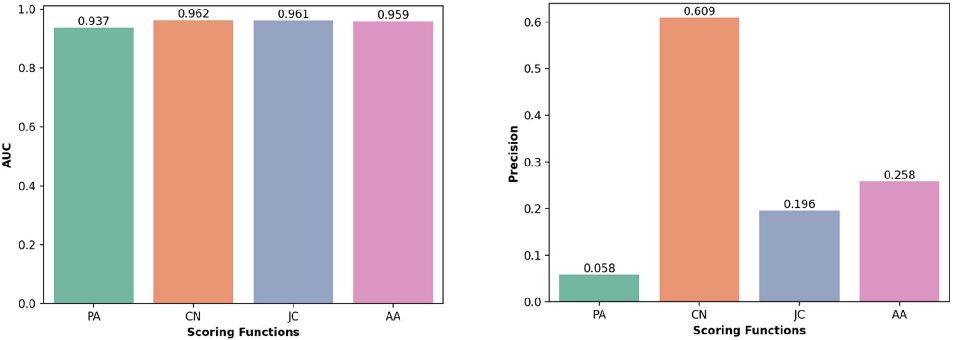
Computational prediction of new therapeutic effects of probiotics.
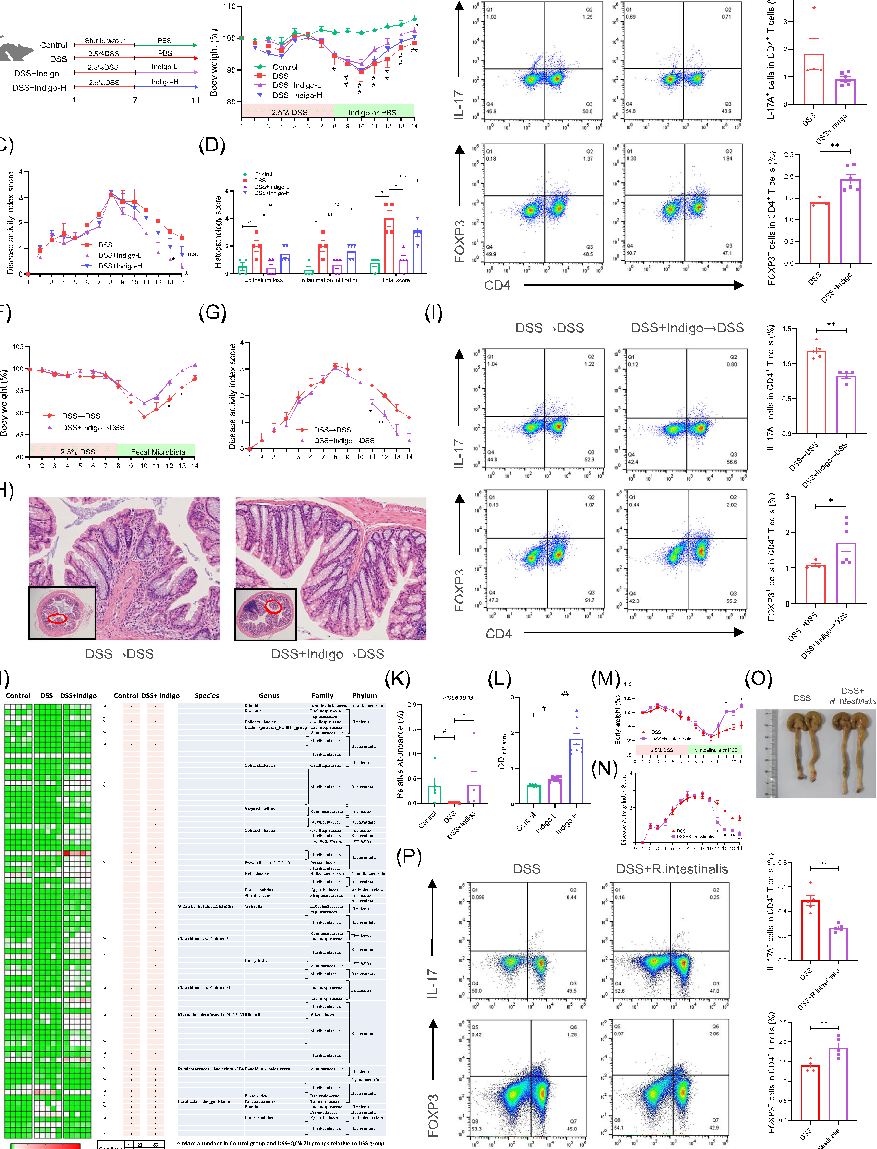
Experimental results examining gut microbiota, with data points illustrating key findings related to this study explored the effect of plant-derived indigo supplementation on intestinal inflammation using in vivo, in v.
Gut microbiota-derived butyrate mediates the anticolitic effect of indigo supplementation through regulating …
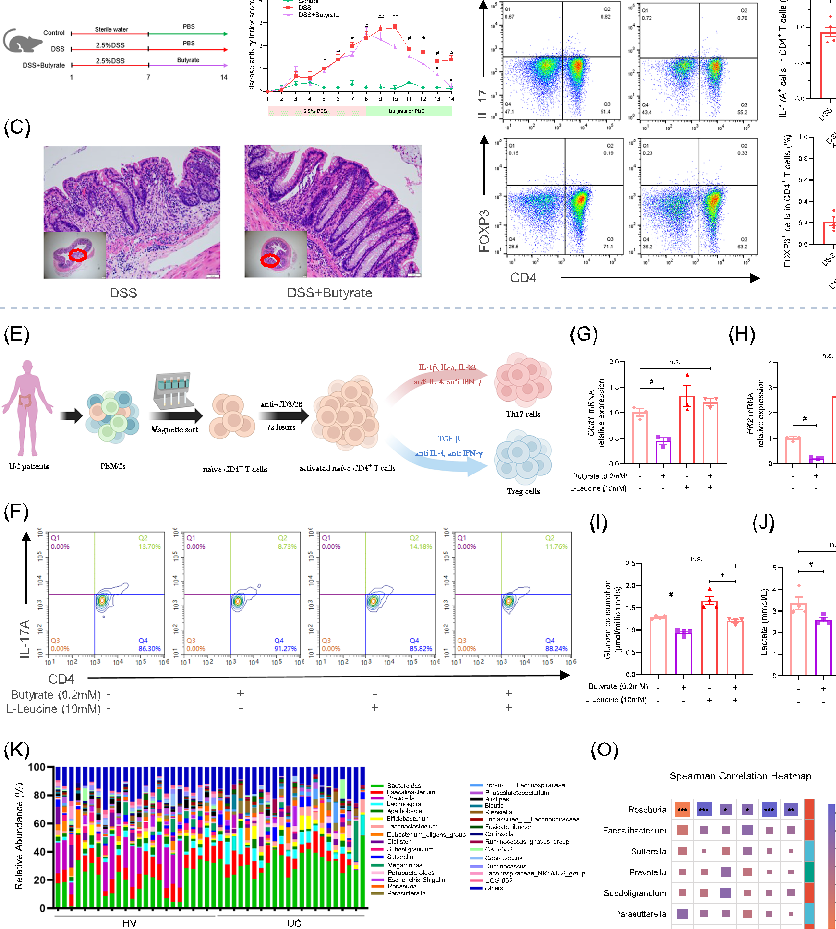
Statistical analysis from research investigating gut microbiota, comparing treatment groups and control conditions.
Gut microbiota-derived butyrate mediates the anticolitic effect of indigo supplementation through regulating …
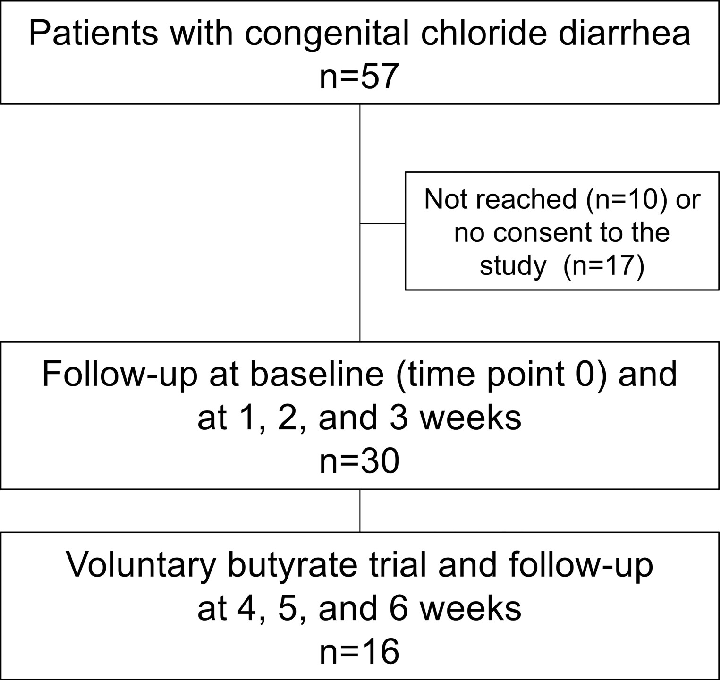
Fig 1. Study participant selection and follow-up. https://doi.org/10.1371/journal.pone.0269561.g001
Fecal microbiota in congenital chloride diarrhea and inflammatory bowel disease.
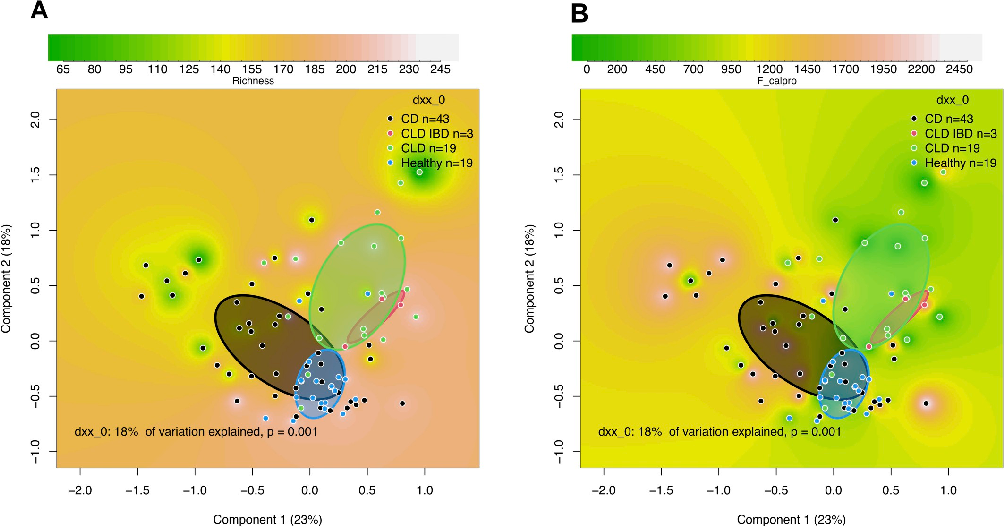
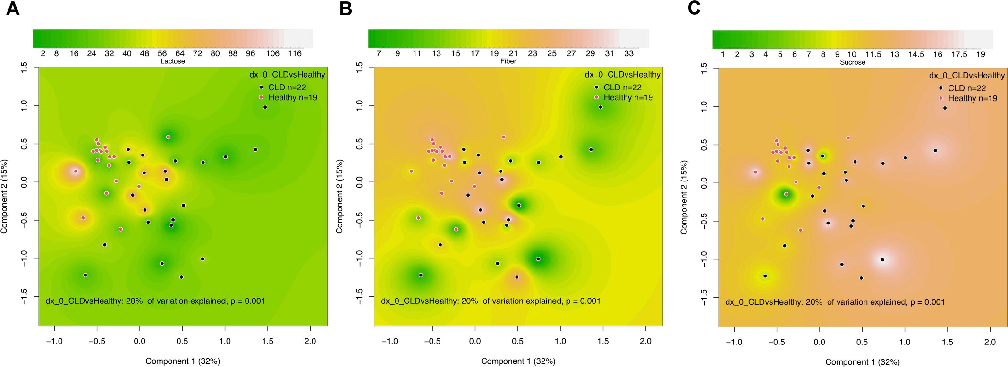
Fig 2. Comparison of fecal microbiota in congenital chloride diarrhea (CLD), CLD-associated inflammatory bowel disease (CLD IBD), Crohn’s disease (CD), and healthy controls. Shown are Principal-coordinate Analysis (PcoA) plots based …
Fecal microbiota in congenital chloride diarrhea and inflammatory bowel disease.
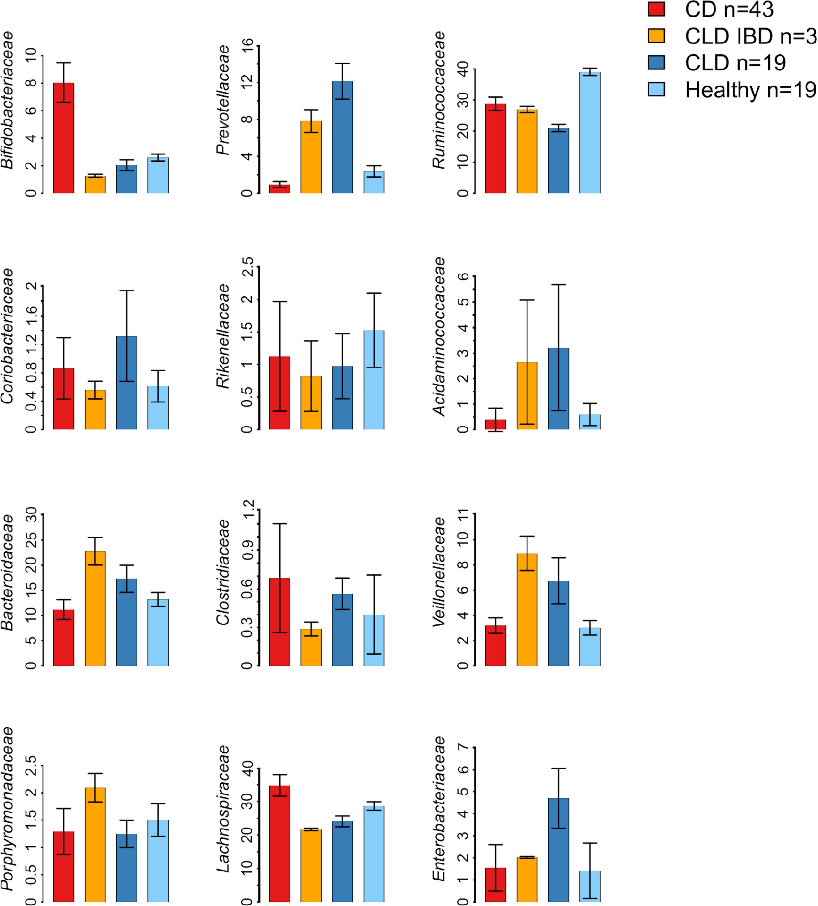
Fig 3. Microbiota composition in congenital chloride diarrhea (CLD), CLD-associated IBD (CLD IBD), Crohn’s disease (CD), and healthy controls. Shown are family-level microbiota composition for the taxa with significant differences …
Fecal microbiota in congenital chloride diarrhea and inflammatory bowel disease.
Fecal microbiota in congenital chloride diarrhea and inflammatory bowel disease.
Experimental results examining effect of Nuts on Gastrointestinal Health, with data points illustrating key findings related to nuts are high nutrient-dense foods containing healthy lipids, dietary fiber, and bioactive phytochemicals, including .
Effect of Nuts on Gastrointestinal Health.
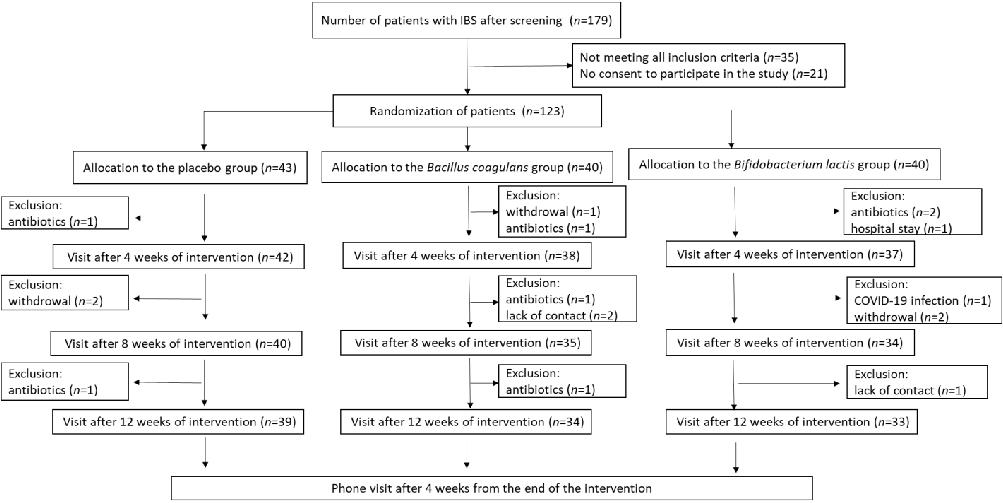
Supplementary outcome data from the randomized trial evaluating single-strain probiotics for irritable bowel syndrome, comparing gastrointestinal symptom improvements across treatment arms.
The Efficacy and Safety of Single-Strain Probiotic Formulations Containing Bifidobacterium lactis or …
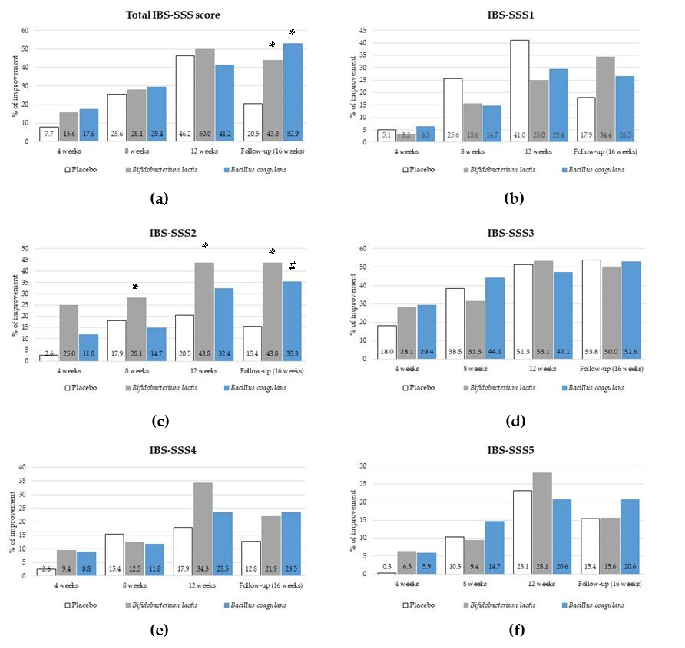
Probiotic intervention outcomes assessed by IBS Severity Scoring System (IBS-SSS) in a three-arm clinical trial. Both Bifidobacterium lactis BI040 and Bacillus coagulans BC300 groups showed statistically significant improvement in total IBS-SSS scores compared to placebo.
The Efficacy and Safety of Single-Strain Probiotic Formulations Containing Bifidobacterium lactis or …
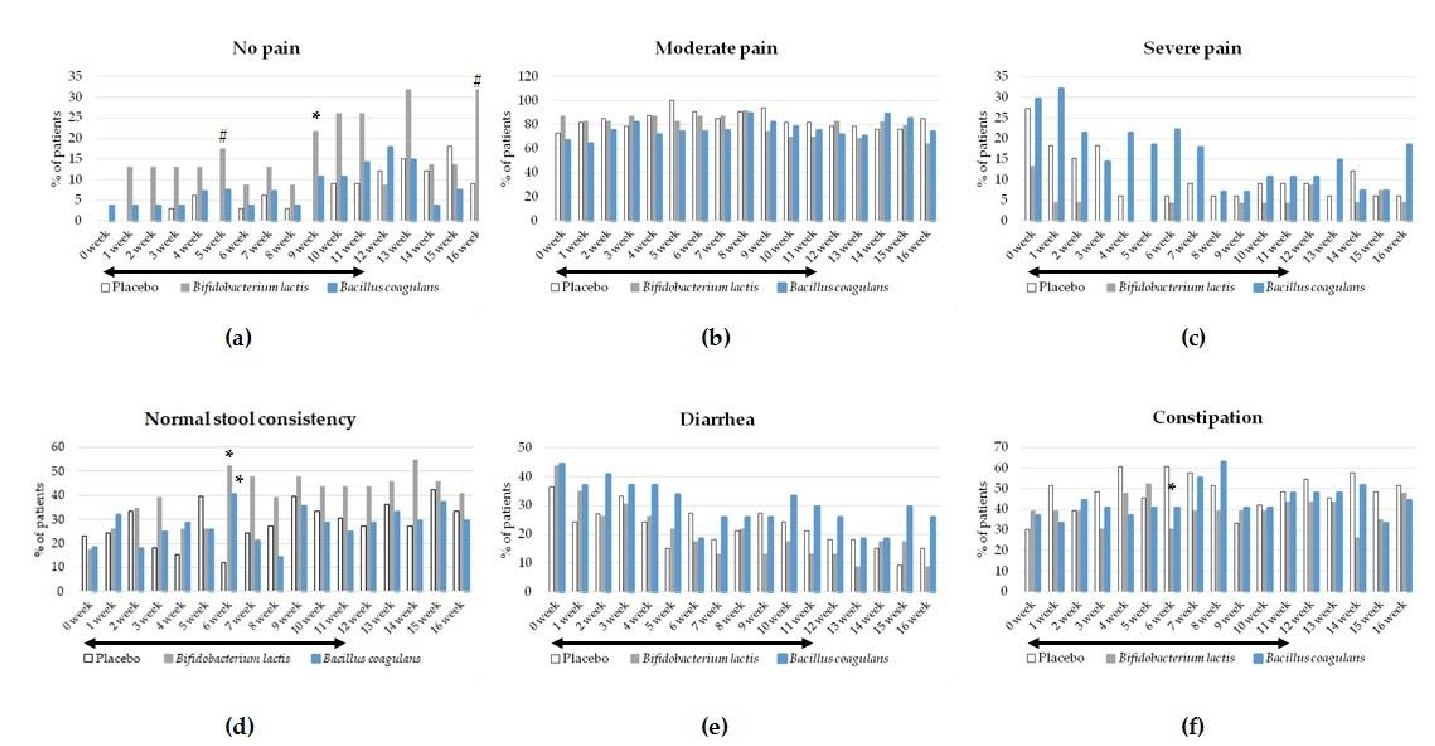
Supplementary outcome data from the randomized trial evaluating single-strain probiotics for irritable bowel syndrome, comparing gastrointestinal symptom improvements across treatment arms.
The Efficacy and Safety of Single-Strain Probiotic Formulations Containing Bifidobacterium lactis or …
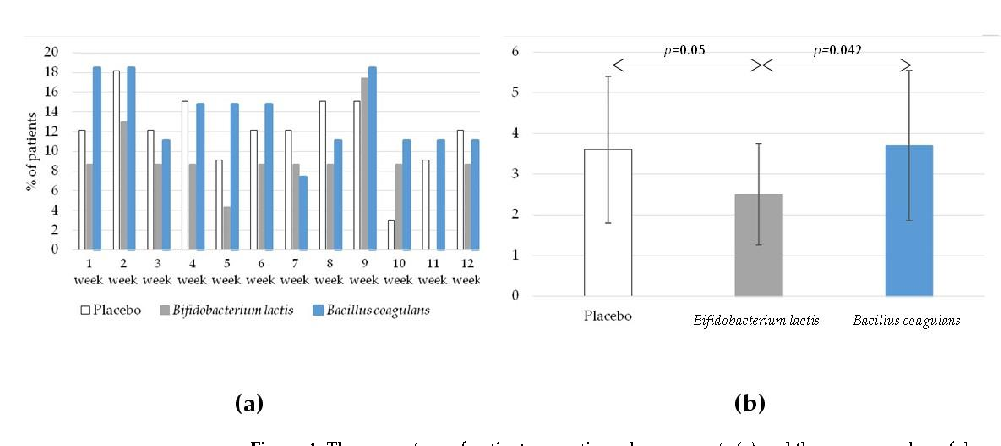
Supplementary outcome data from the randomized trial evaluating single-strain probiotics for irritable bowel syndrome, comparing gastrointestinal symptom improvements across treatment arms.
The Efficacy and Safety of Single-Strain Probiotic Formulations Containing Bifidobacterium lactis or …
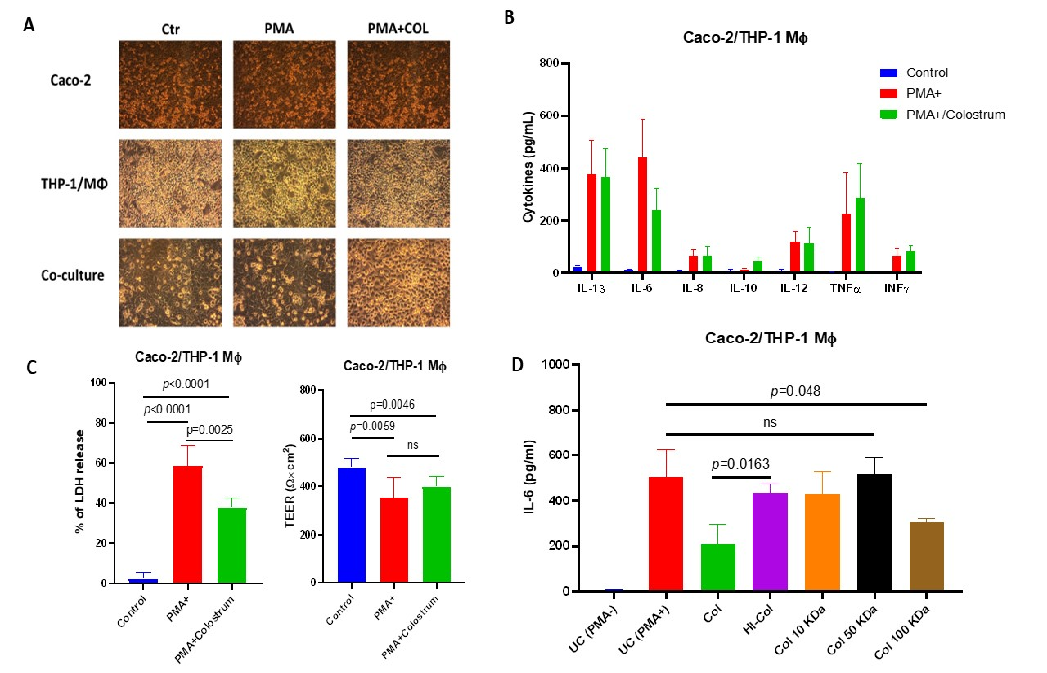
Extended analysis of bovine colostrum's effects on inflammatory cytokine profiles in the Caco-2/THP-1 co-culture system, demonstrating dose-dependent immunomodulatory activity.
Understanding the Immunomodulatory Effects of Bovine Colostrum: Insights into IL-6/IL-10 Axis-Mediated Inflammatory …
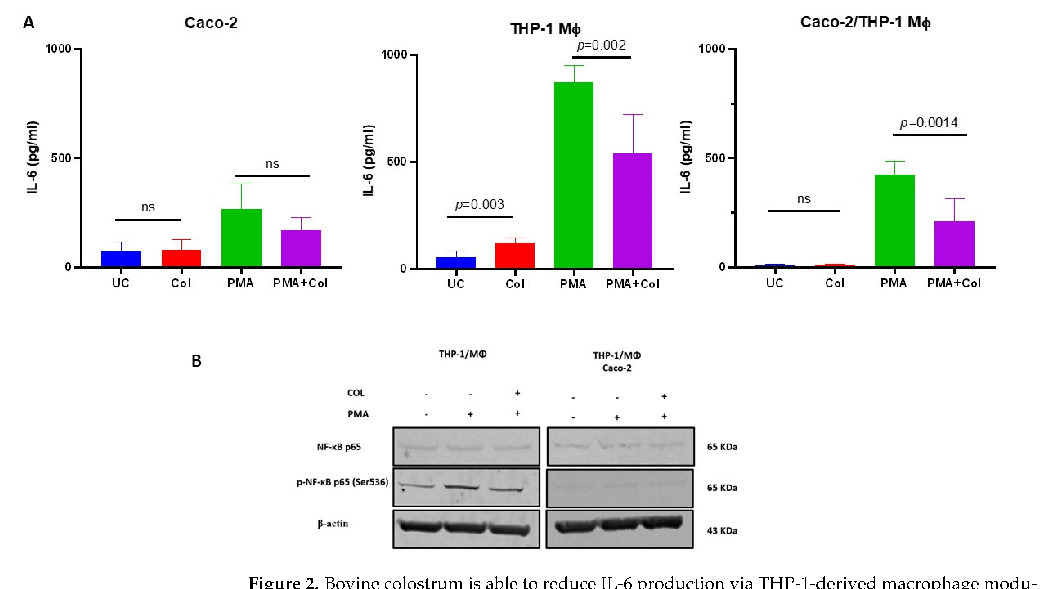
Supplementary immunological data showing bovine colostrum's influence on macrophage-mediated inflammation, with particular focus on the balance between pro- and anti-inflammatory responses.
Understanding the Immunomodulatory Effects of Bovine Colostrum: Insights into IL-6/IL-10 Axis-Mediated Inflammatory …
Additional cytokine measurement data from bovine colostrum-treated cell cultures, comparing IL-6 and IL-10 levels across different treatment conditions.
Understanding the Immunomodulatory Effects of Bovine Colostrum: Insights into IL-6/IL-10 Axis-Mediated Inflammatory …
Further in vitro data demonstrating bovine colostrum's immunomodulatory capacity, including its effects on PMA-stimulated inflammatory signaling pathways.
Understanding the Immunomodulatory Effects of Bovine Colostrum: Insights into IL-6/IL-10 Axis-Mediated Inflammatory …
Gene expression or protein analysis data related to the IL-6/IL-10 signaling axis in bovine colostrum-treated macrophage co-cultures.
Understanding the Immunomodulatory Effects of Bovine Colostrum: Insights into IL-6/IL-10 Axis-Mediated Inflammatory …
Supplementary experimental data from the bovine colostrum immunomodulation study, supporting the role of colostrum bioactive compounds in inflammatory control.
Understanding the Immunomodulatory Effects of Bovine Colostrum: Insights into IL-6/IL-10 Axis-Mediated Inflammatory …
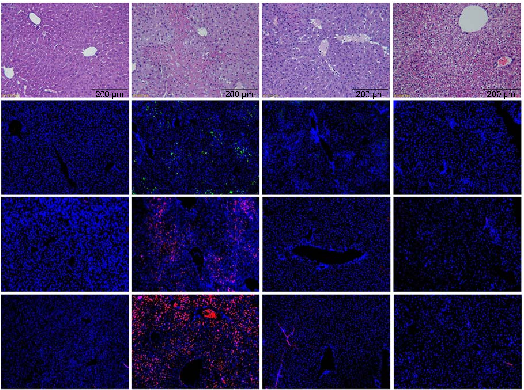
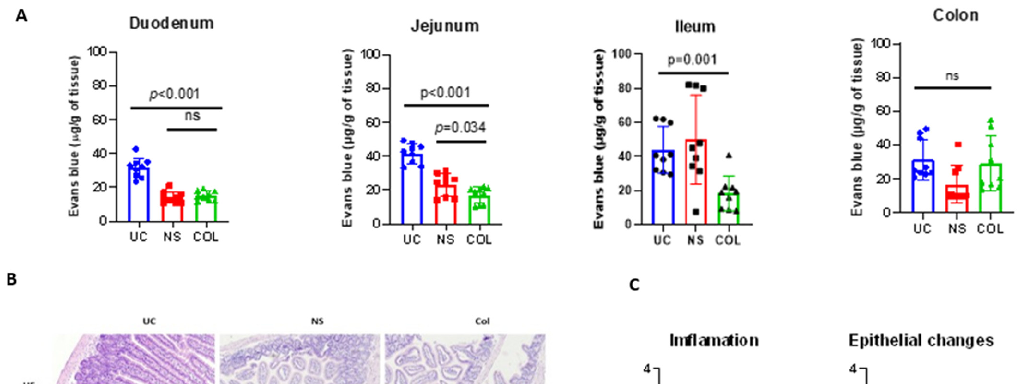
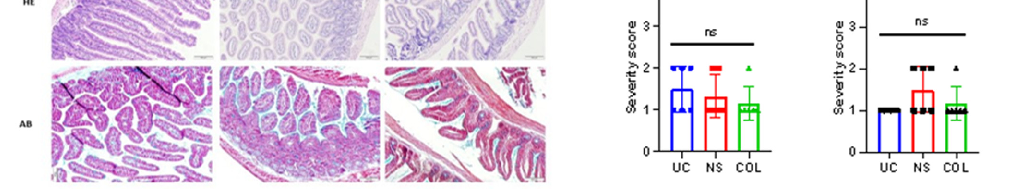
Correlation analysis between gut microbiota changes and hepatic inflammation markers in berberine-treated mice with autoimmune hepatitis.
Berberine alleviates concanavalin A-induced autoimmune hepatitis in mice by modulating the gut …
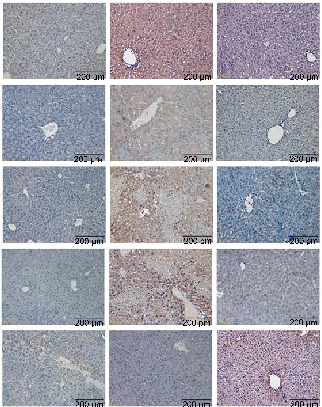
Supplementary experimental data (panel 11) from the berberine autoimmune hepatitis study, providing additional evidence of gut microbiota modulation and hepatoprotective effects in the concanavalin A mouse model.
Berberine alleviates concanavalin A-induced autoimmune hepatitis in mice by modulating the gut …
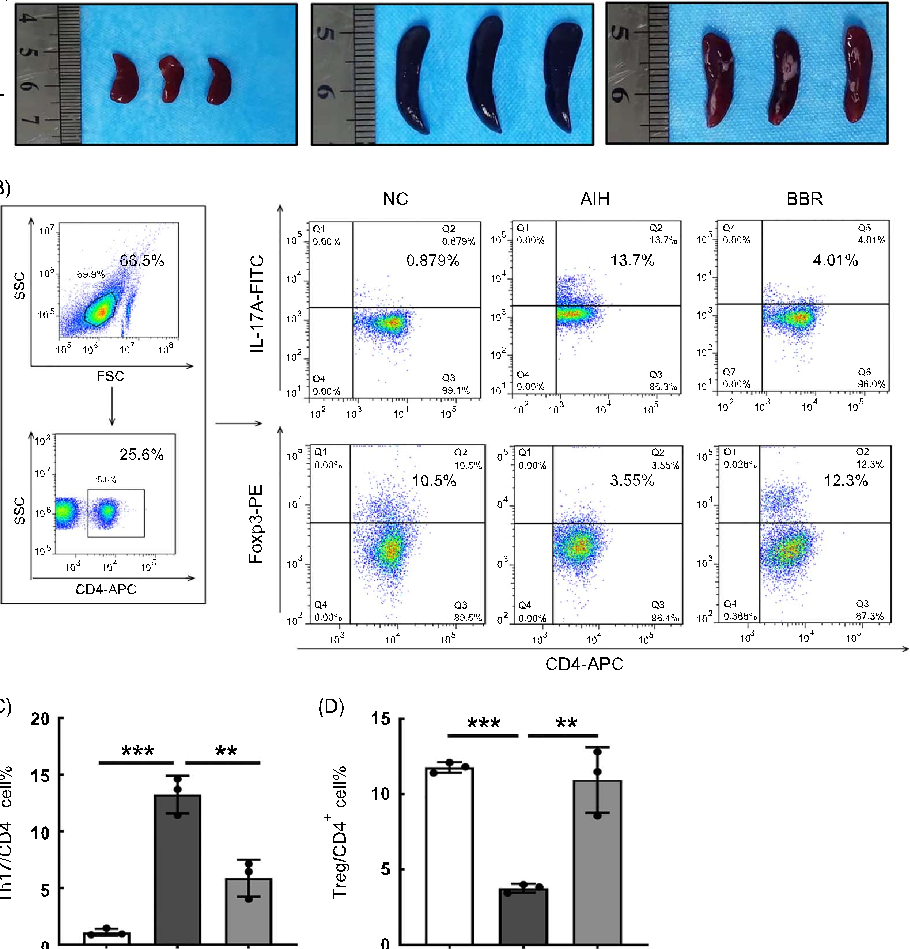
Graphical summary of berberine's mechanism of action in alleviating concanavalin A-induced autoimmune hepatitis in mice, highlighting its role in modulating the gut microbiota and restoring intestinal barrier integrity.
Berberine alleviates concanavalin A-induced autoimmune hepatitis in mice by modulating the gut …
Page 15 of 20