Lactase Hình ảnh
11 hình ảnh từ nghiên cứu có bình duyệt
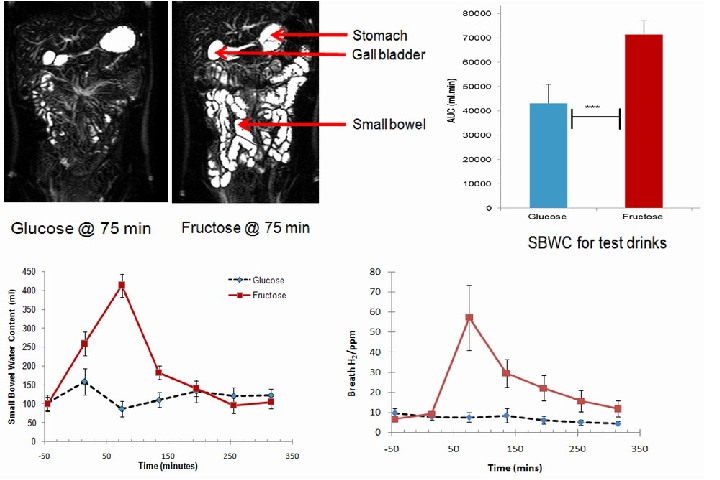
Small bowel water content and breath hydrogen concentrations after consuming glucose and fructose drinks are plotted over time, providing reference data for comparison with lactose challenge tests.
Lactose Intolerance in Adults: Biological Mechanism and Dietary Management.
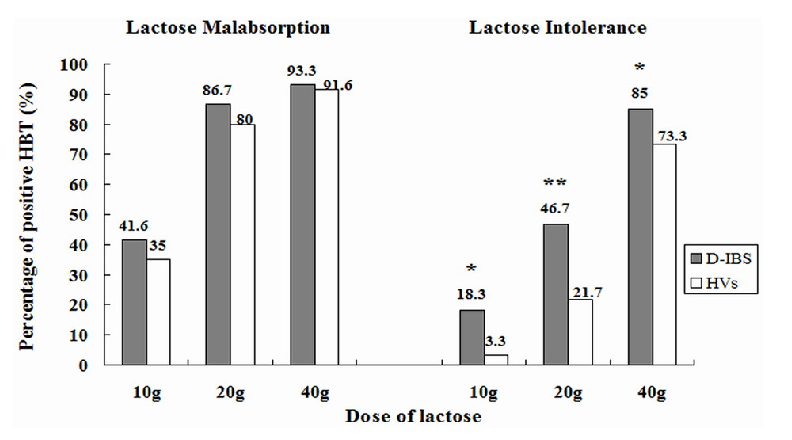
Prevalence of lactose malabsorption versus symptomatic lactose intolerance in IBS-D patients is compared, demonstrating that malabsorption does not invariably produce clinical symptoms.
Lactose Intolerance in Adults: Biological Mechanism and Dietary Management.
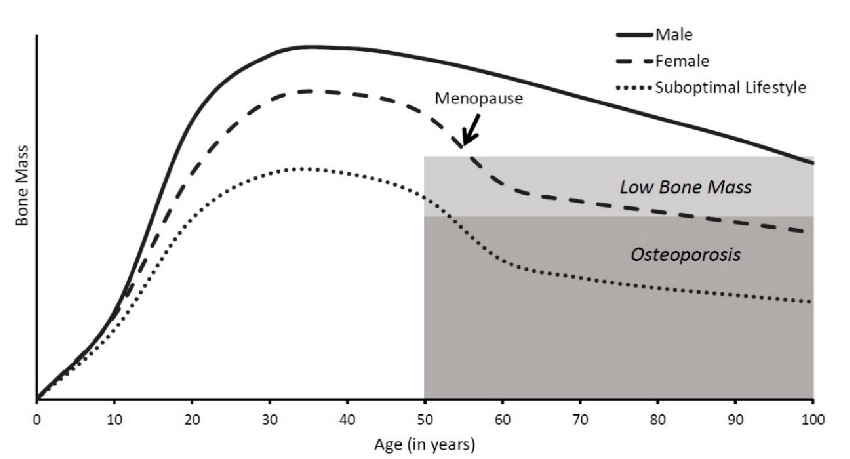
Bone mass changes throughout the human lifespan are charted, showing rapid accumulation during childhood, peak bone mass around age 30, and subsequent gradual decline. Females typically experience accelerated bone loss after menopause, underscoring the importance of adequate calcium intake in earlier decades.
Lactose Intolerance and Bone Health: The Challenge of Ensuring Adequate Calcium Intake.
Alpha diversity indices of fecal microbiota are plotted for treated versus placebo groups, indicating whether probiotic supplementation altered overall bacterial community richness.
Effects of Bifidobacterium longum and Lactobacillus rhamnosus on Gut Microbiota in Patients …
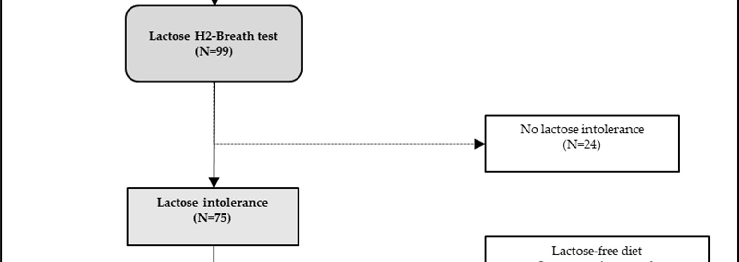
Lactose tolerance test outcomes are compared between intervention groups, with symptom severity mapped against breath hydrogen concentrations.
Effects of Bifidobacterium longum and Lactobacillus rhamnosus on Gut Microbiota in Patients …
Fecal short-chain fatty acid concentrations are measured across treatment groups, reflecting metabolic activity changes in the gut microbiome following probiotic administration.
Effects of Bifidobacterium longum and Lactobacillus rhamnosus on Gut Microbiota in Patients …
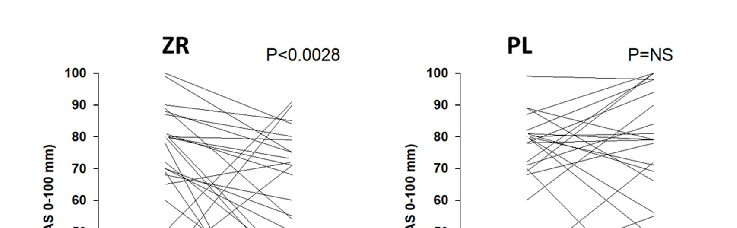
Individual patient trajectories for bloating severity, measured on a 0-100 mm visual analogue scale, are plotted at baseline and after 30 days for both the probiotic treatment and placebo groups.
Effects of Bifidobacterium longum and Lactobacillus rhamnosus on Gut Microbiota in Patients …
Symptom improvement scores for lactose-intolerant patients receiving a combined Bifidobacterium longum and Lactobacillus rhamnosus preparation are compared with placebo responses over the treatment period.
Effects of Bifidobacterium longum and Lactobacillus rhamnosus on Gut Microbiota in Patients …

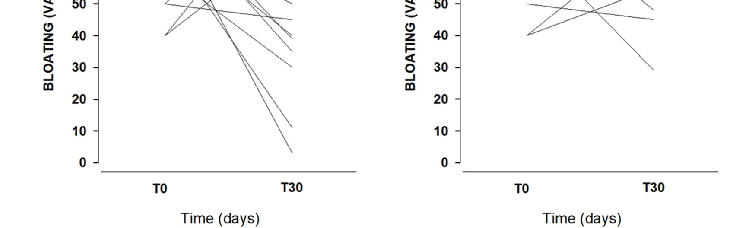
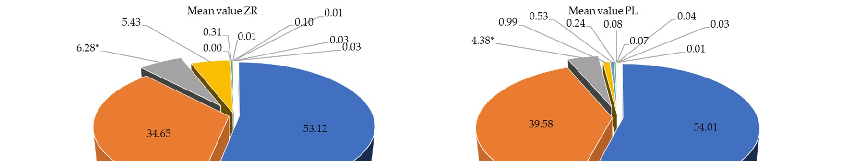
Relative proportions of bacterial phyla in fecal samples are compared between probiotic-treated and placebo groups, revealing shifts in gut microbiota composition following Bifidobacterium longum and Lactobacillus rhamnosus supplementation.
Effects of Bifidobacterium longum and Lactobacillus rhamnosus on Gut Microbiota in Patients …
Hydrogen breath test results before and after probiotic supplementation are presented, indicating alterations in lactose fermentation patterns associated with treatment.
Effects of Bifidobacterium longum and Lactobacillus rhamnosus on Gut Microbiota in Patients …
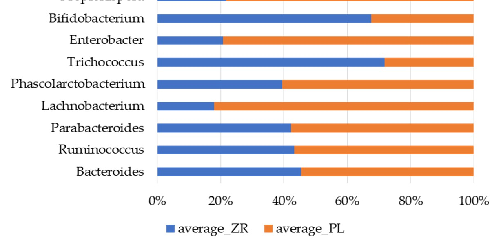
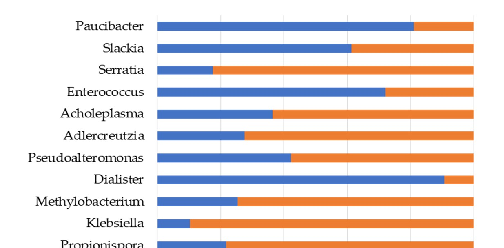
Bacterial genera showing statistically significant differences between probiotic-treated and placebo patients are depicted, highlighting specific microbial populations responsive to Bifidobacterium and Lactobacillus supplementation.
Effects of Bifidobacterium longum and Lactobacillus rhamnosus on Gut Microbiota in Patients …