Butyrate (Sodium/Calcium Butyrate) Hình ảnh
58 hình ảnh từ nghiên cứu có bình duyệt
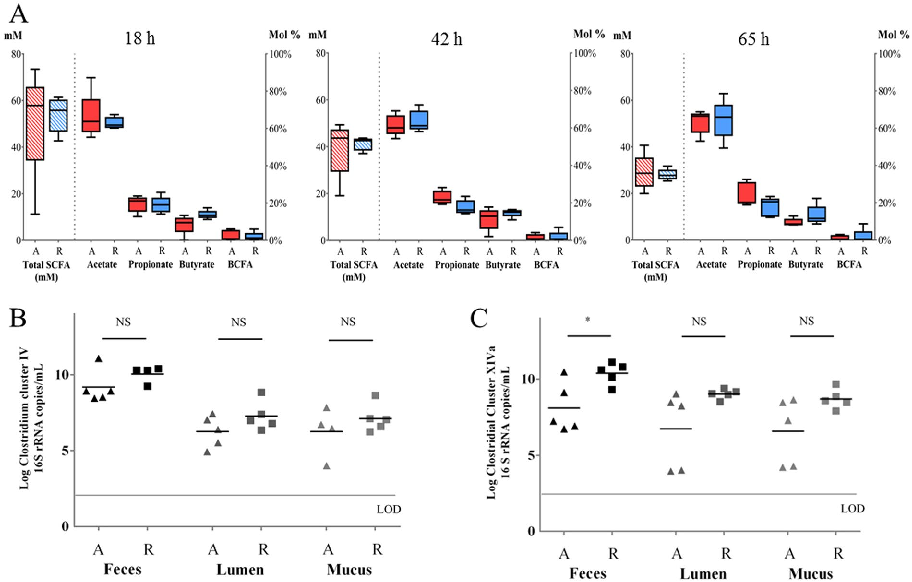
Butyrate and other short-chain fatty acid concentrations measured in the in vitro fermentation model show significant increases following supplementation with targeted bacterial strains.
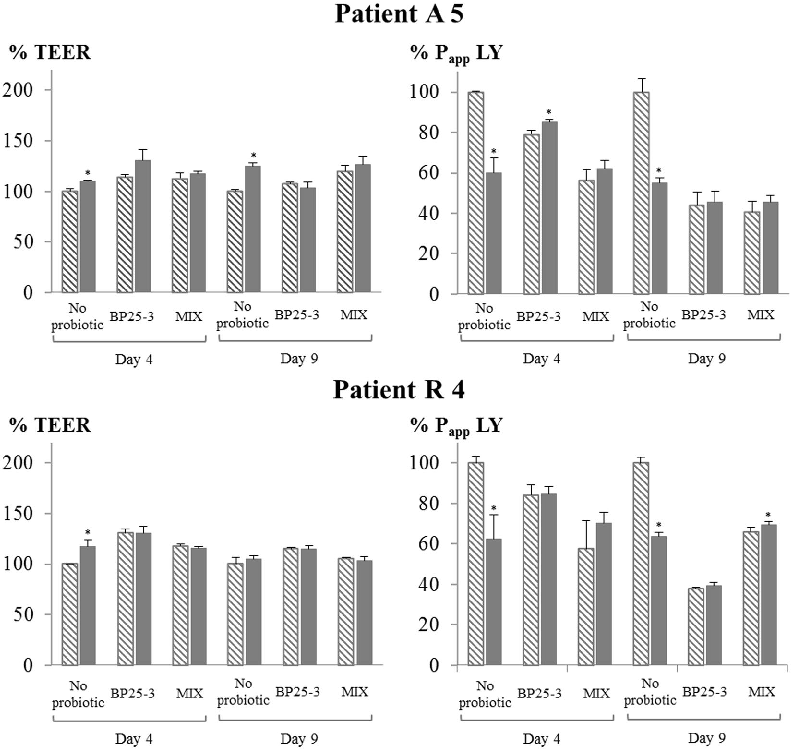
Butyrate-producing bacteria supplemented in vitro to Crohn's disease patient microbiota increased butyrate …
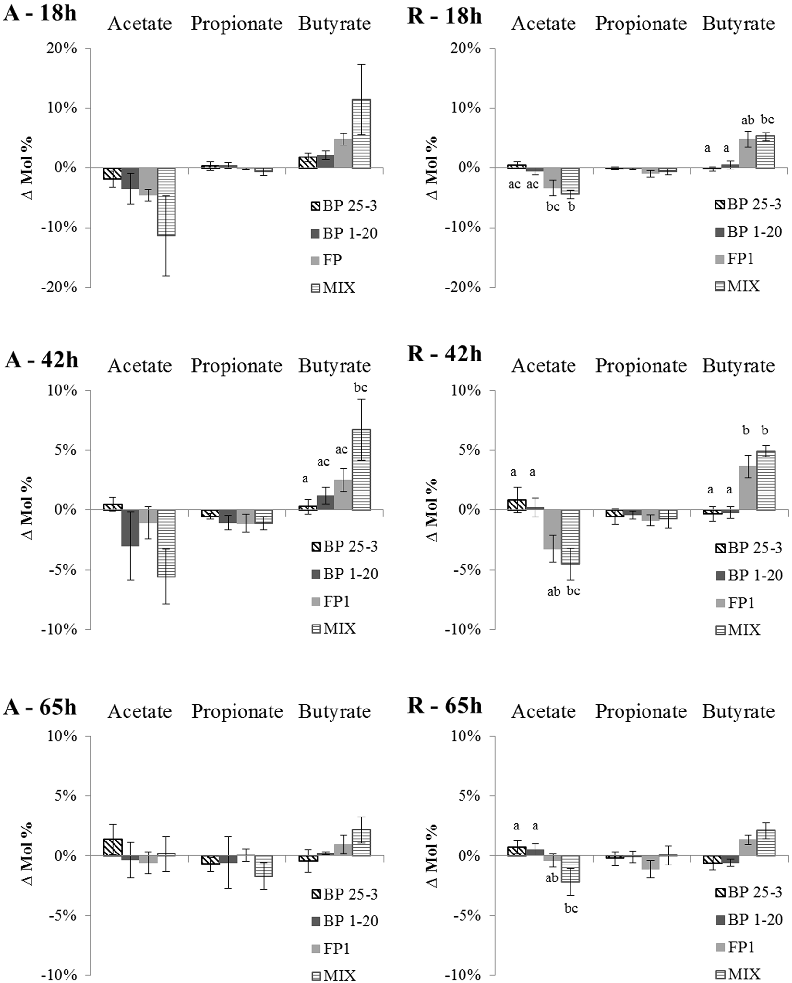
Relative abundance shifts in key bacterial taxa after supplementation are displayed, highlighting the engraftment success of introduced butyrate producers.
Butyrate-producing bacteria supplemented in vitro to Crohn's disease patient microbiota increased butyrate …
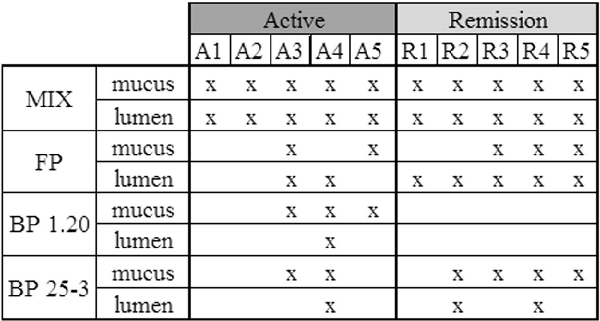
pH changes and metabolite profiles in the fermentation vessel over time demonstrate the metabolic impact of butyrate-producing bacterial supplementation.
Butyrate-producing bacteria supplemented in vitro to Crohn's disease patient microbiota increased butyrate …
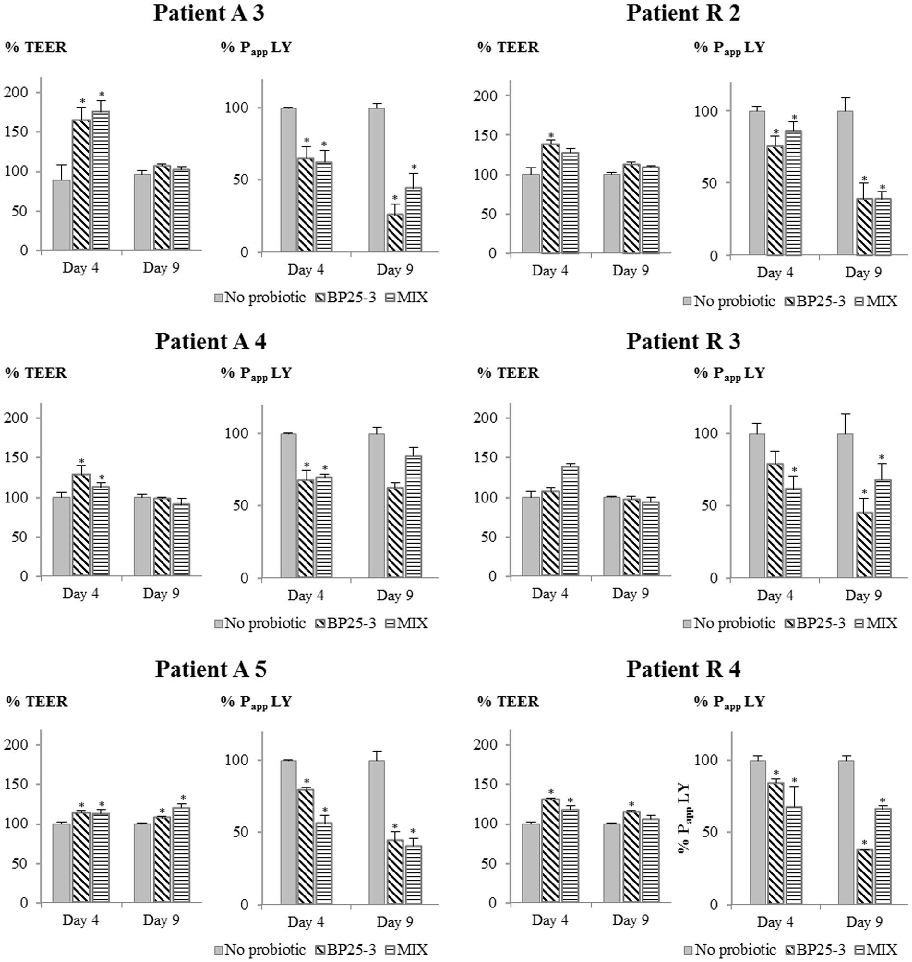
Diversity indices comparing baseline Crohn's disease microbiota to supplemented samples suggest partial restoration of microbial community richness.
Butyrate-producing bacteria supplemented in vitro to Crohn's disease patient microbiota increased butyrate …
Correlation analysis between butyrate concentration increases and shifts in specific bacterial genera reveals ecological relationships within the supplemented microbiota.
Butyrate-producing bacteria supplemented in vitro to Crohn's disease patient microbiota increased butyrate …
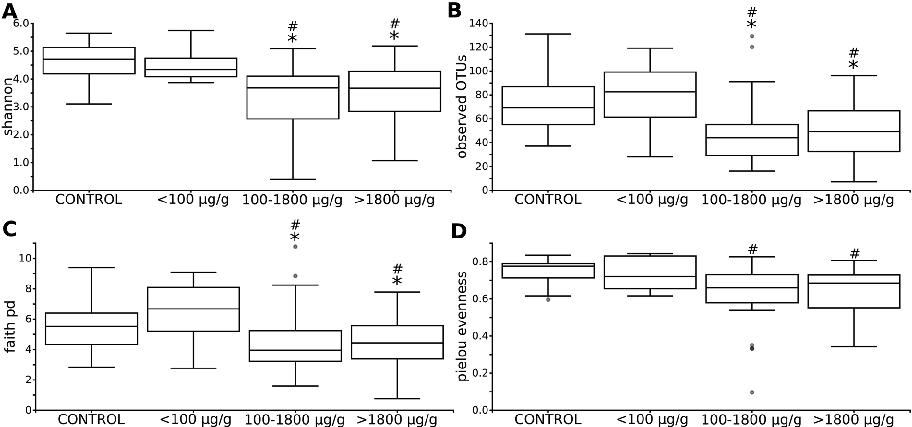
Gut microbiota alpha diversity metrics, including Shannon index and observed species richness, are compared before and after butyrate supplementation. Changes in diversity differ between Crohn's disease and ulcerative colitis subgroups.
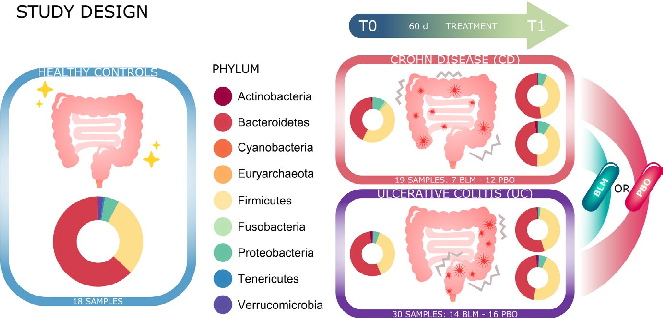
Microbiota changes induced by microencapsulated sodium butyrate in patients with inflammatory bowel …
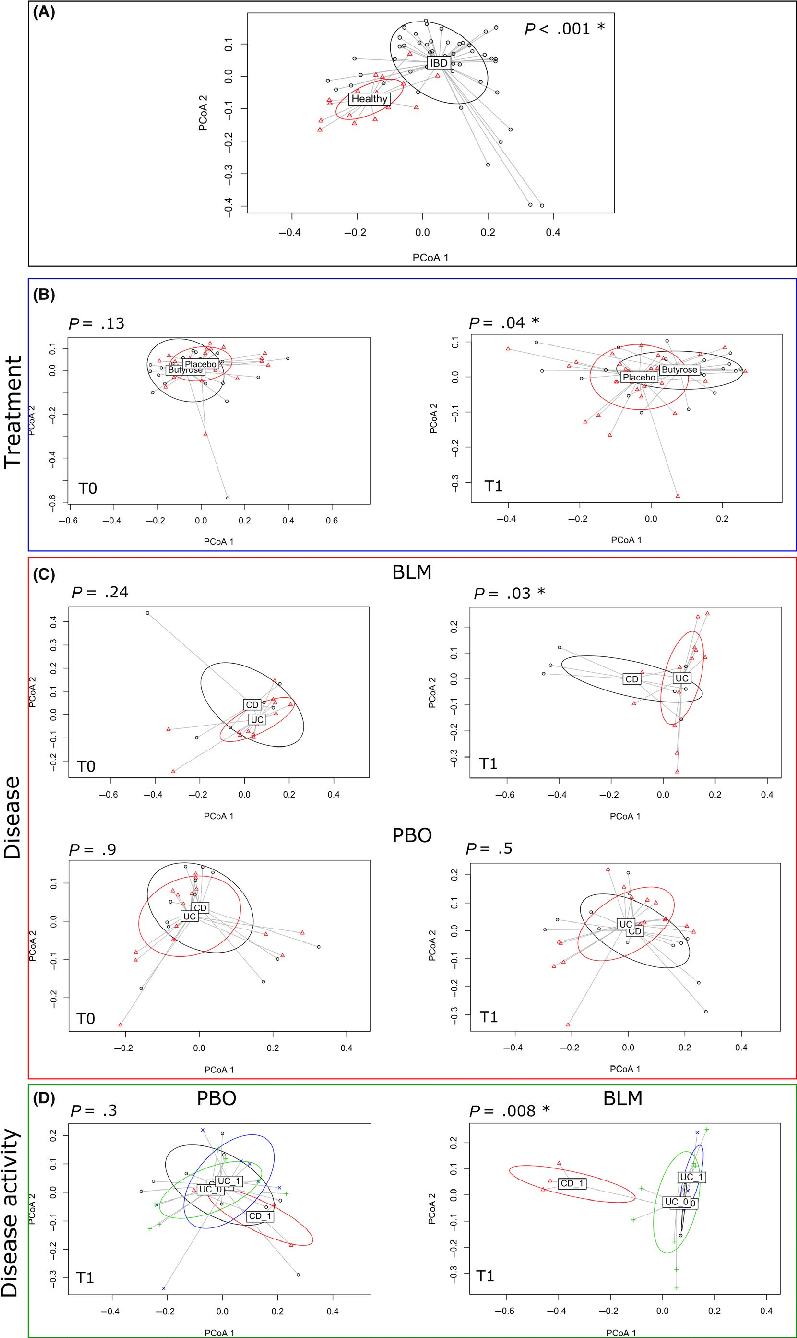
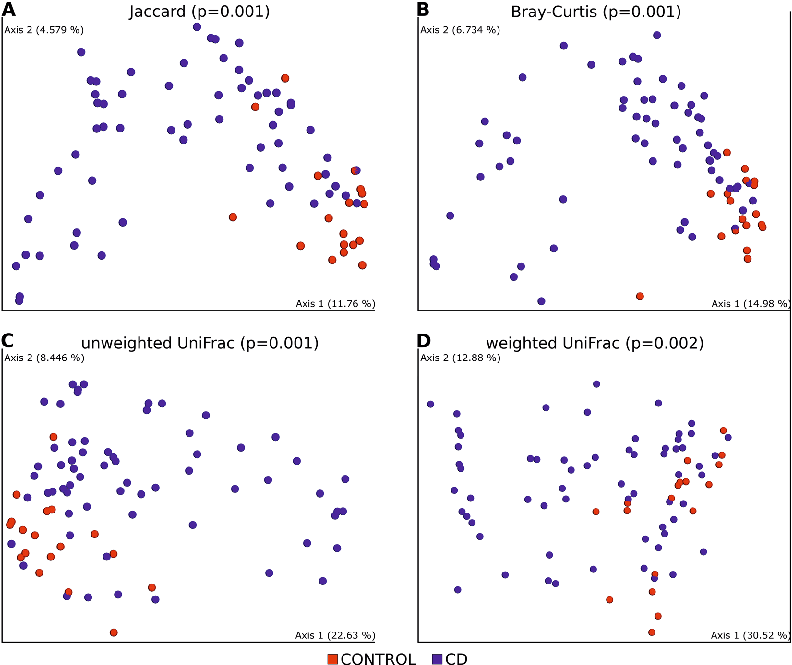
Beta diversity analysis using principal coordinates reveals shifts in overall microbiota community structure following butyrate supplementation. Separation between pre- and post-treatment samples suggests reproducible compositional changes.
Microbiota changes induced by microencapsulated sodium butyrate in patients with inflammatory bowel …
Clinical evidence from intervention studies suggests that butyrate supplementation, either orally or via enema, may reduce disease activity scores in ulcerative colitis patients. Response rates vary across delivery methods and formulations.
Gut Microbial Metabolite Butyrate and Its Therapeutic Role in Inflammatory Bowel Disease: …
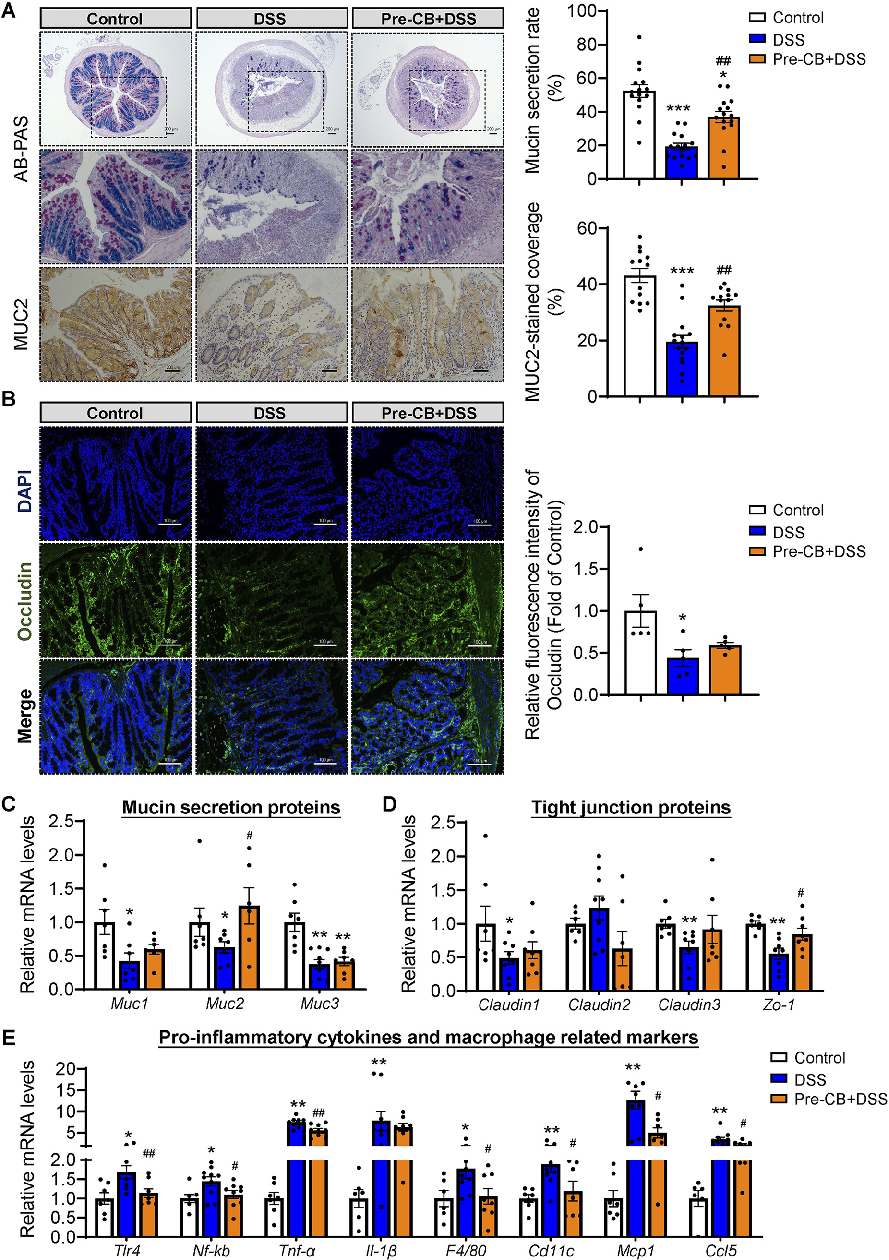
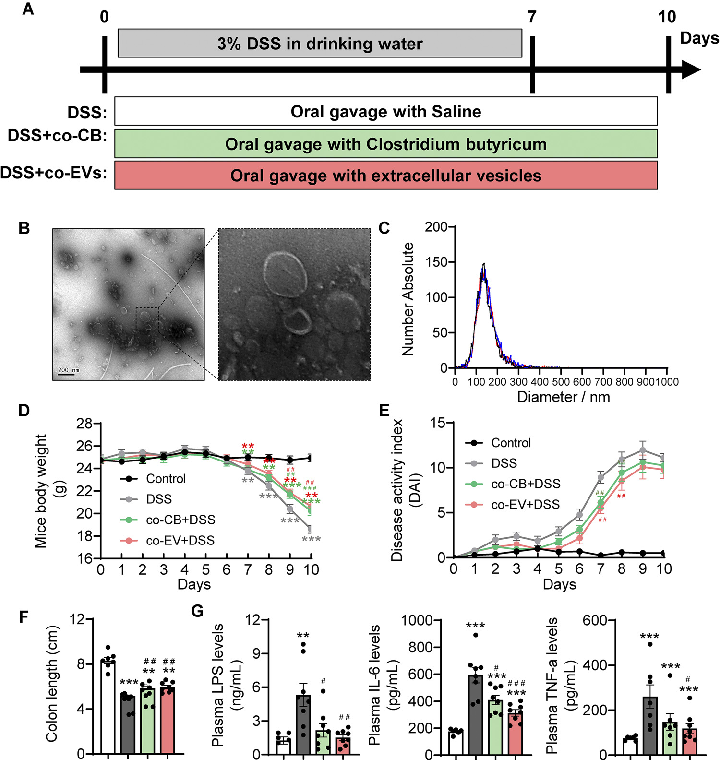
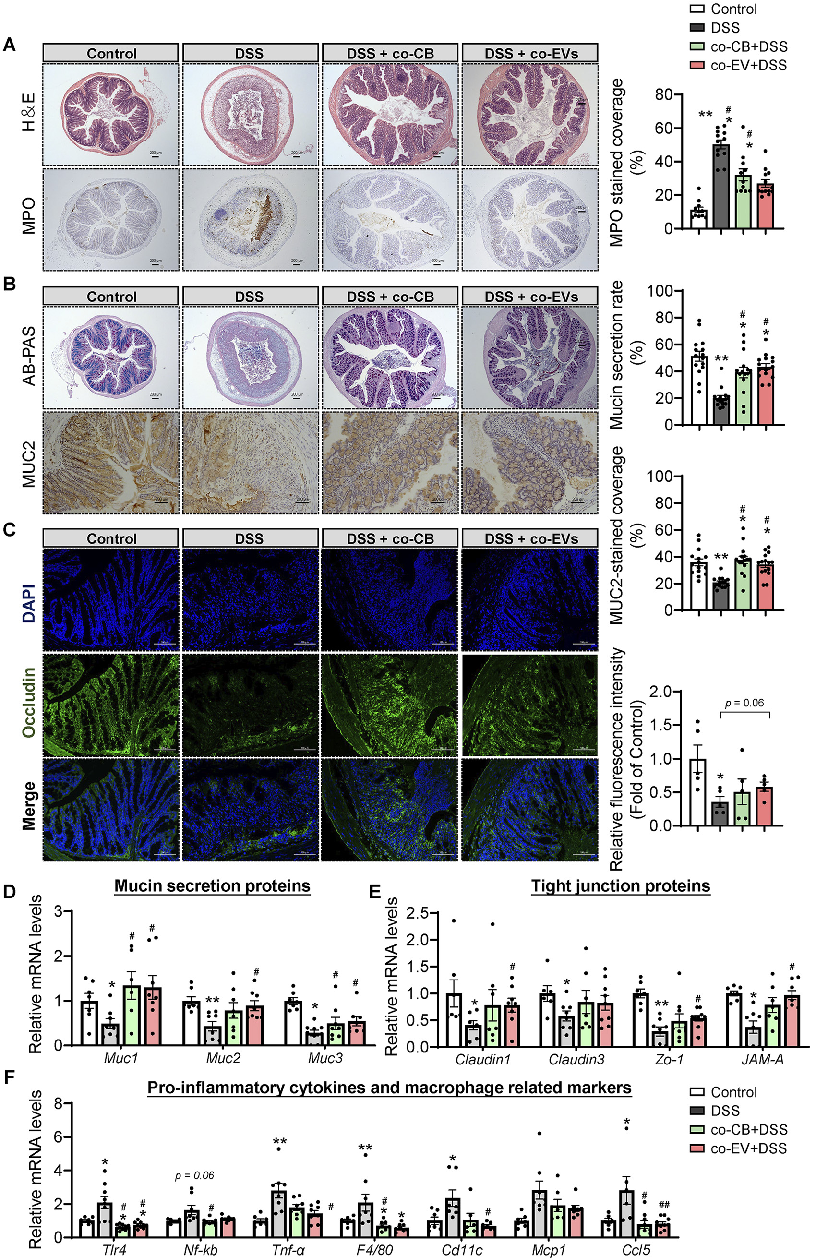
Pro-inflammatory cytokine levels in colonic tissue were quantified to assess the anti-inflammatory effects of C. butyricum treatment. This figure presents TNF-alpha, IL-6, and IL-1beta expression data across experimental groups.
Clostridium butyricum and Its Derived Extracellular Vesicles Modulate Gut Homeostasis and Ameliorate …
Tight junction protein expression indicates intestinal barrier integrity. This figure shows changes in occludin, claudin, and ZO-1 levels in colonic tissue following C. butyricum or vesicle treatment.
Clostridium butyricum and Its Derived Extracellular Vesicles Modulate Gut Homeostasis and Ameliorate …
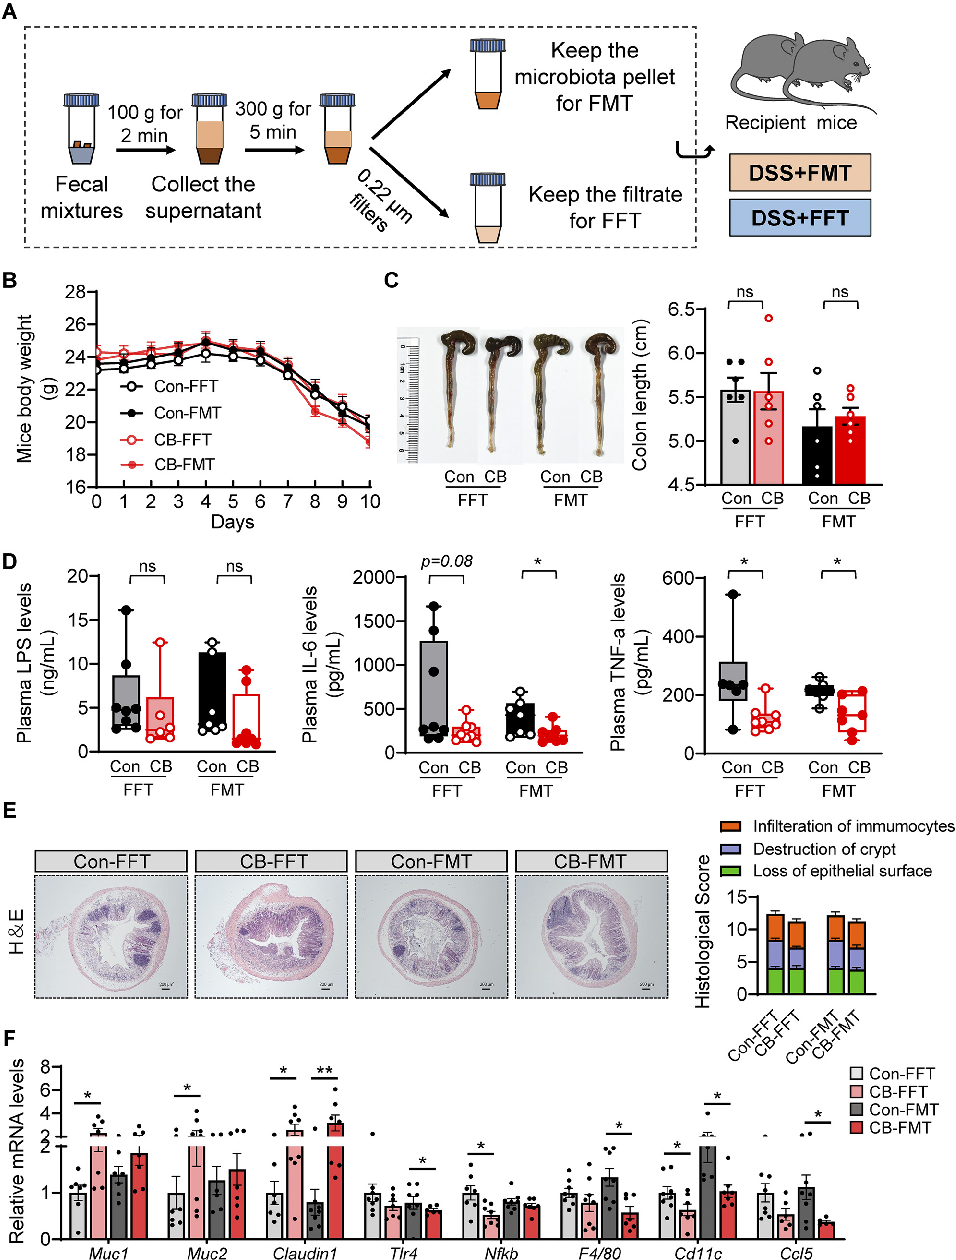
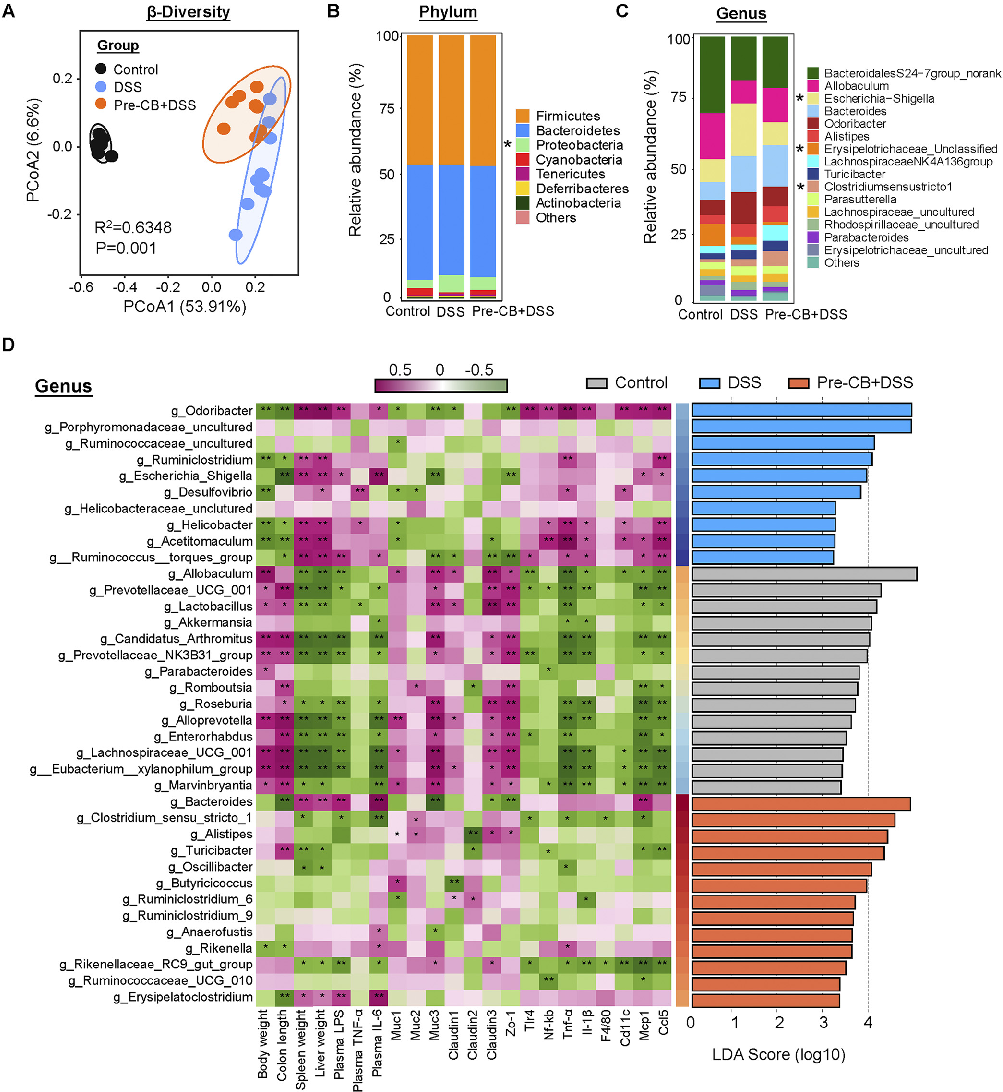
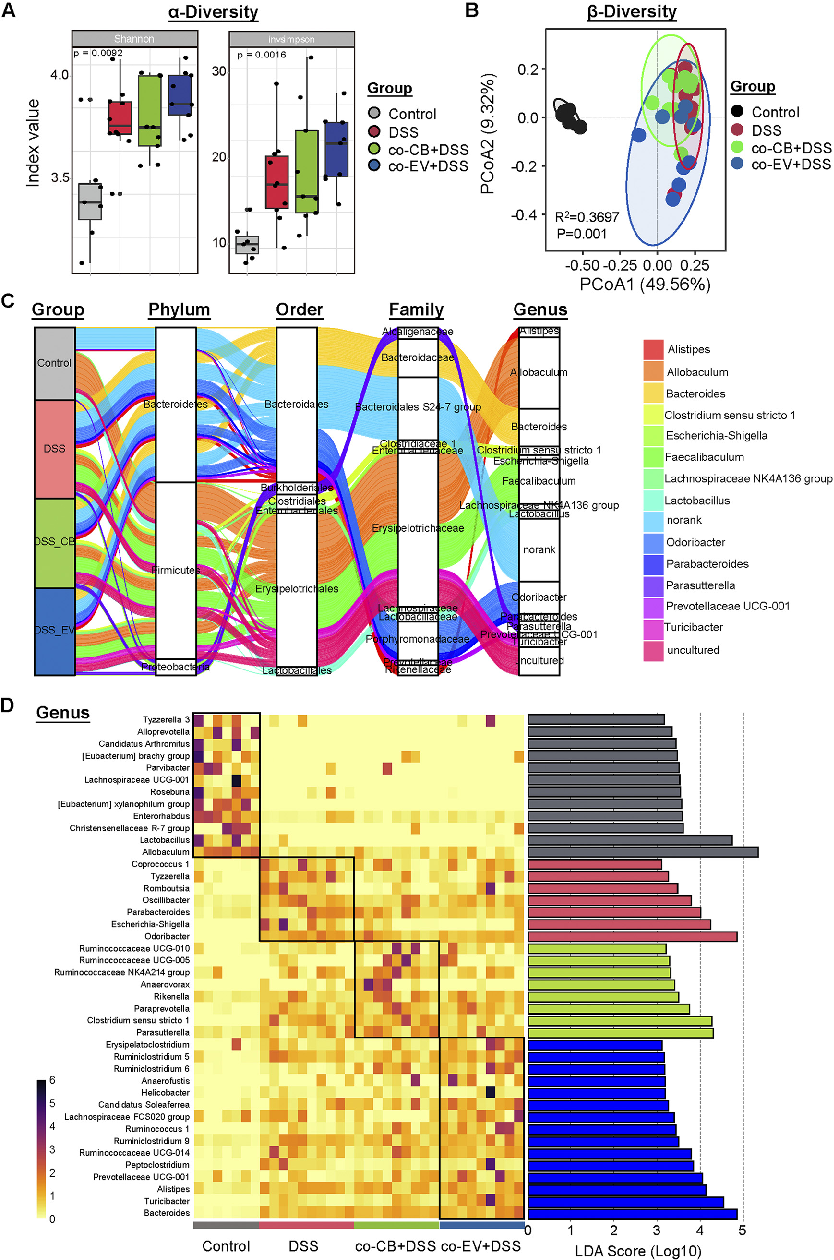
Gut microbiome composition was analyzed to determine how C. butyricum treatment modulates the intestinal microbial community. This figure presents 16S rRNA sequencing data showing microbial diversity and taxonomic abundance.
Clostridium butyricum and Its Derived Extracellular Vesicles Modulate Gut Homeostasis and Ameliorate …
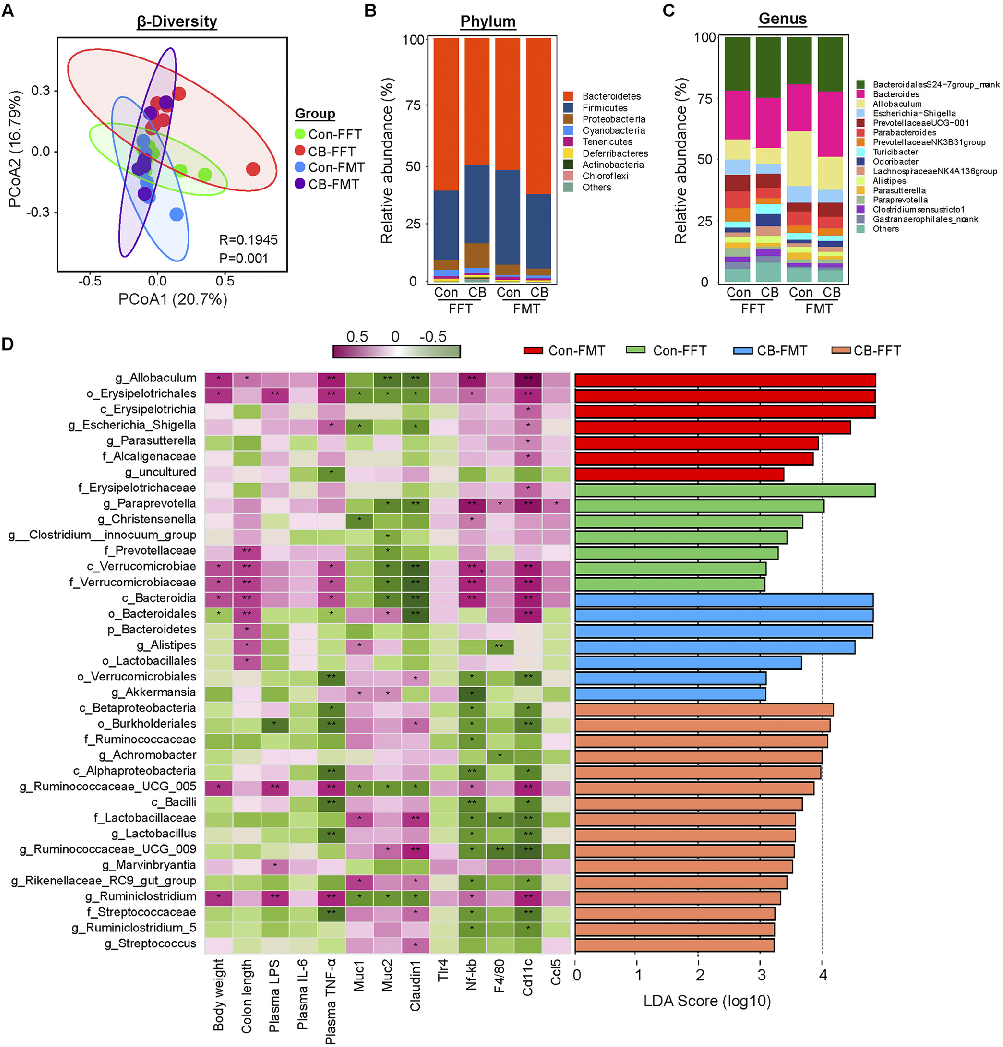
Alpha and beta diversity metrics reveal shifts in gut microbial community structure following probiotic intervention. This figure compares microbiome diversity indices between C. butyricum-treated and control groups.
Clostridium butyricum and Its Derived Extracellular Vesicles Modulate Gut Homeostasis and Ameliorate …
Specific bacterial taxa were differentially abundant in C. butyricum-treated mice compared to controls. This figure highlights the key microbial shifts associated with amelioration of colitis symptoms.
Clostridium butyricum and Its Derived Extracellular Vesicles Modulate Gut Homeostasis and Ameliorate …
Short-chain fatty acid production in the gut is modulated by C. butyricum colonization. This figure presents metabolomic data on butyrate and other SCFA concentrations in the colonic lumen.
Clostridium butyricum and Its Derived Extracellular Vesicles Modulate Gut Homeostasis and Ameliorate …
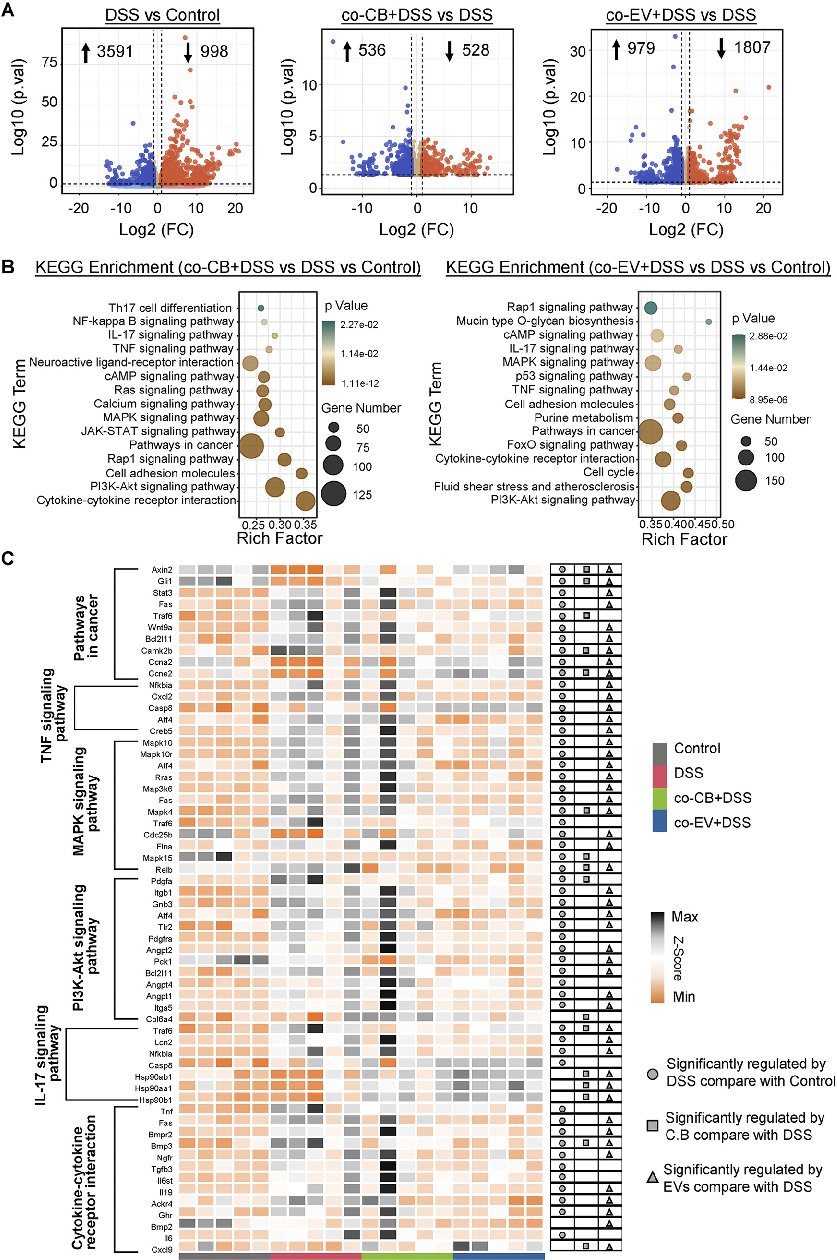
Signaling pathway analysis reveals molecular mechanisms underlying C. butyricum's protective effects. This figure presents Western blot or gene expression data for key inflammatory and barrier-related signaling pathways.
Clostridium butyricum and Its Derived Extracellular Vesicles Modulate Gut Homeostasis and Ameliorate …
Extracellular vesicles from C. butyricum may directly modulate intestinal epithelial cell responses. This figure presents in vitro data on vesicle uptake and downstream cellular effects in colonic epithelial cultures.
Clostridium butyricum and Its Derived Extracellular Vesicles Modulate Gut Homeostasis and Ameliorate …
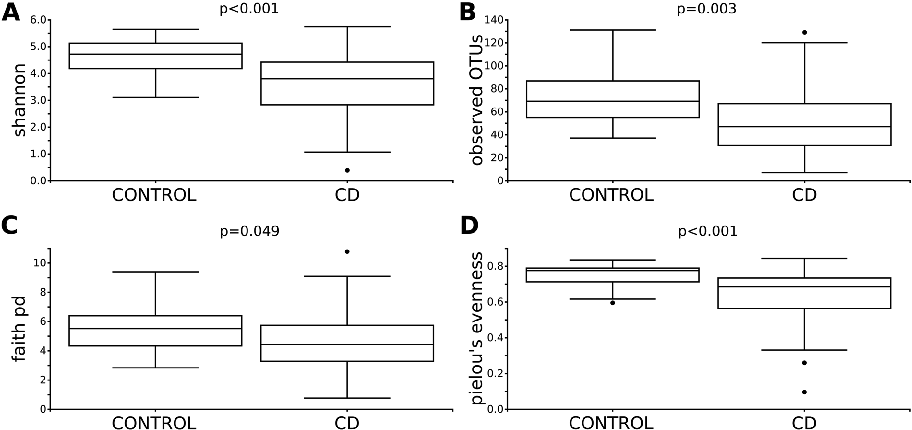
Microbial diversity comparison between healthy children and treatment-naive pediatric patients with newly diagnosed Crohn's disease. Alpha or beta diversity metrics reveal differences in the intestinal microbiome composition at disease onset.
Differences in the intestinal microbiome of healthy children and patients with newly …
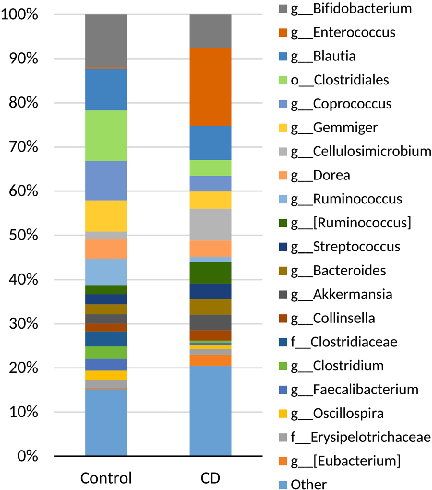
Taxonomic composition analysis showing the relative abundance of major bacterial phyla or families in stool samples from pediatric Crohn's disease patients versus healthy controls.
Differences in the intestinal microbiome of healthy children and patients with newly …
Principal coordinate analysis or ordination plot illustrating the separation in gut microbial community structure between children with newly diagnosed Crohn's disease and age-matched healthy controls.
Differences in the intestinal microbiome of healthy children and patients with newly …
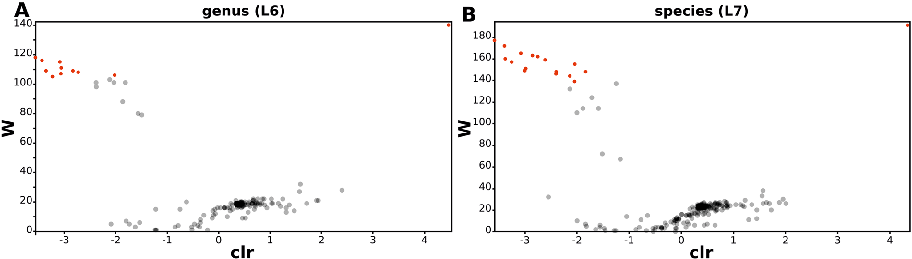
Differential abundance analysis identifying specific bacterial taxa that are significantly enriched or depleted in the intestinal microbiome of treatment-naive pediatric Crohn's disease patients.
Differences in the intestinal microbiome of healthy children and patients with newly …
Correlation analysis or network diagram showing relationships between specific gut bacterial taxa and clinical parameters in pediatric Crohn's disease at the time of diagnosis.
Differences in the intestinal microbiome of healthy children and patients with newly …
NF-κB signaling pathway activation in intestinal cells is measured with and without butyrate pre-treatment following LPS challenge, demonstrating the short-chain fatty acid's inhibitory capacity.
Butyrate attenuates lipopolysaccharide-induced inflammation in intestinal cells and Crohn's mucosa through modulation …
Gene expression profiles for inflammatory mediators in LPS-stimulated intestinal cells are compared across varying butyrate concentrations, revealing a clear anti-inflammatory dose response.
Butyrate attenuates lipopolysaccharide-induced inflammation in intestinal cells and Crohn's mucosa through modulation …
Cell viability assays confirm that butyrate concentrations used in the inflammation experiments are non-cytotoxic, validating the specificity of observed anti-inflammatory effects.
Butyrate attenuates lipopolysaccharide-induced inflammation in intestinal cells and Crohn's mucosa through modulation …
Trang 1 / 3