研究プロセス
477 査読済み研究からの図表
Quantification of DNA double-strand break repair efficiency in H. pylori-infected gastric cells, indicating that alpha-lipoic acid supports the Ku-dependent non-homologous end joining pathway.
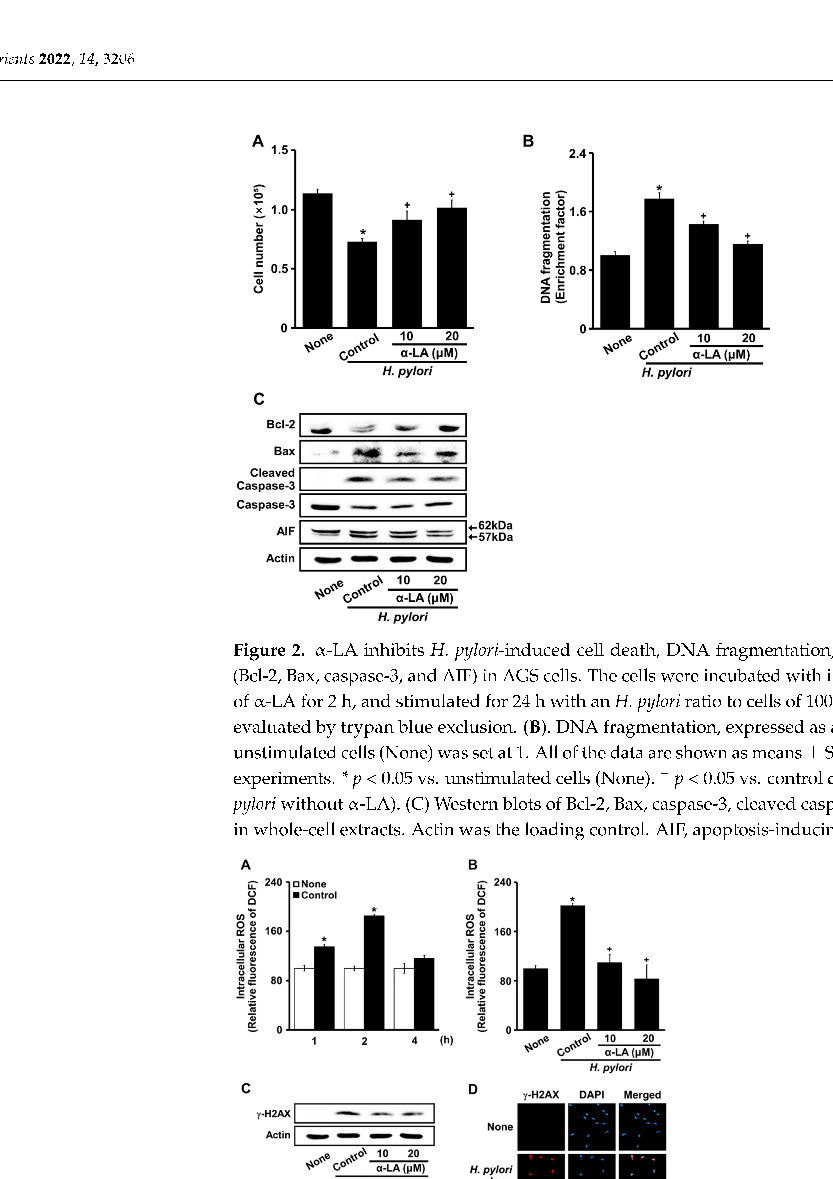
α-Lipoic Acid Inhibits Apoptosis by Suppressing the Loss of Ku Proteins in …
Cell viability analysis across different alpha-lipoic acid concentrations in H. pylori-infected gastric epithelial cells, establishing the effective dose range for cytoprotection.
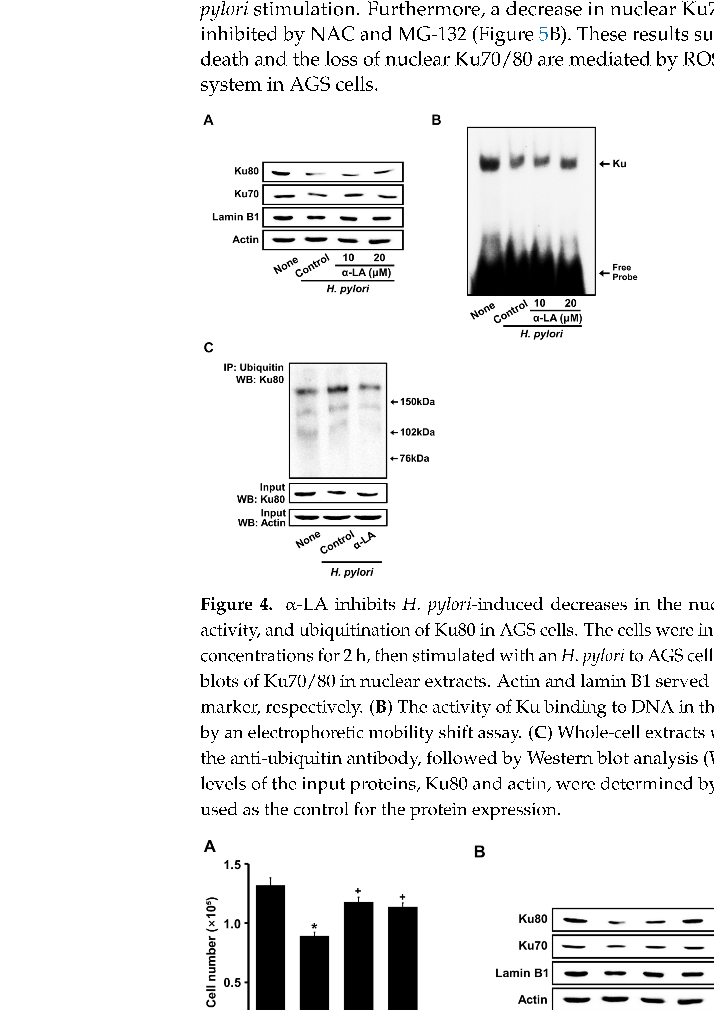
α-Lipoic Acid Inhibits Apoptosis by Suppressing the Loss of Ku Proteins in …
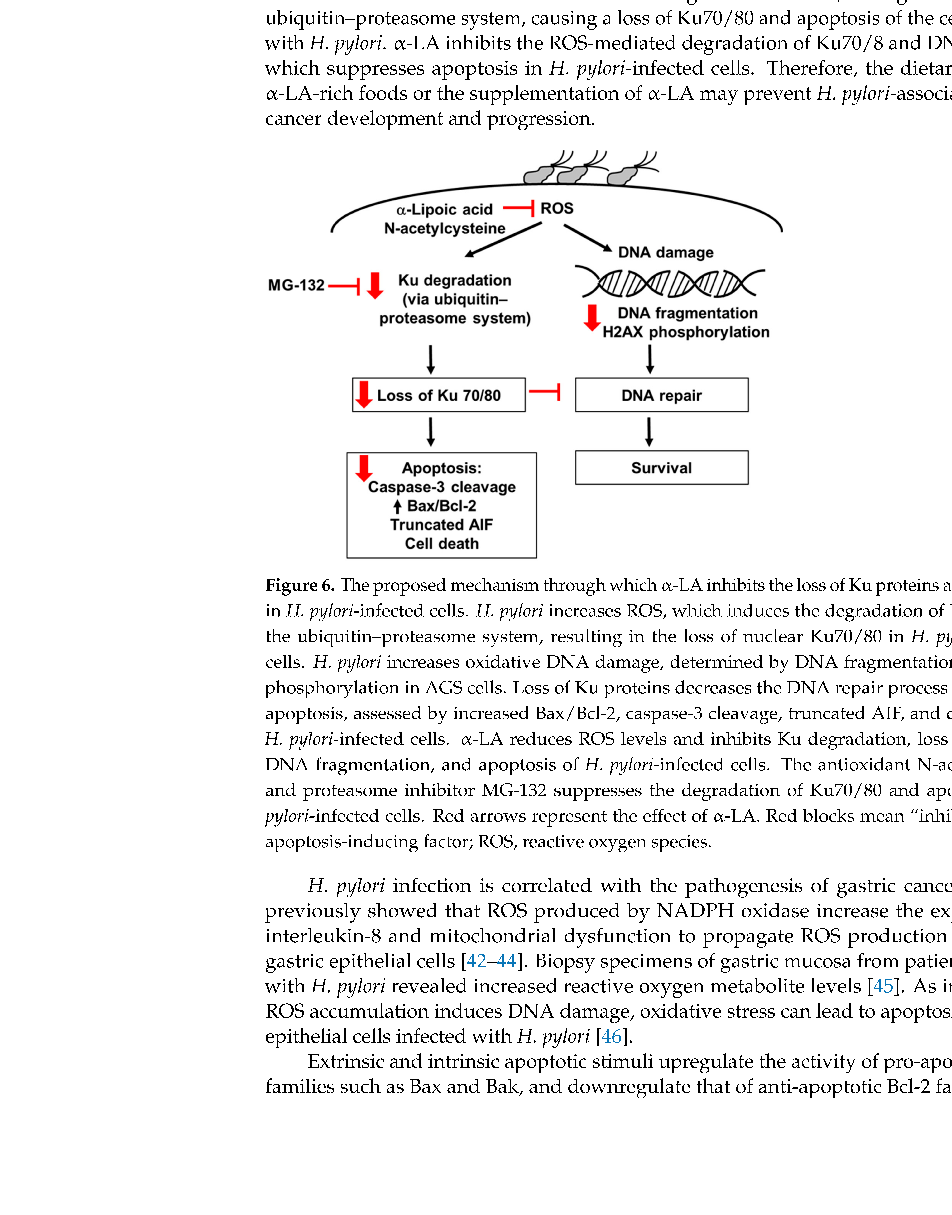
Signaling pathway analysis showing the molecular mechanism by which alpha-lipoic acid preserves Ku protein levels and inhibits apoptosis in H. pylori-infected gastric cells.
α-Lipoic Acid Inhibits Apoptosis by Suppressing the Loss of Ku Proteins in …
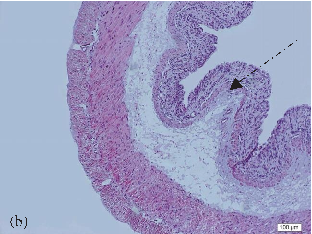
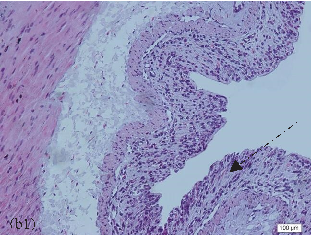
Liver histopathology from colitis-induced mice with and without oral NAC supplementation, evaluating extraintestinal hepatic manifestations including steatosis and inflammatory infiltration.
Extraintestinal Manifestations in Induced Colitis: Controversial Effects of N-Acetylcysteine on Colon, Liver, …
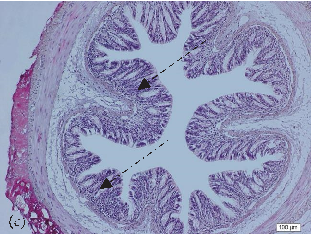
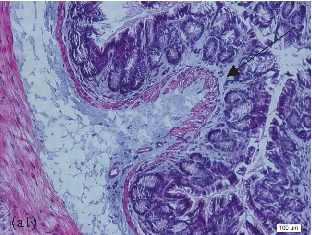
Kidney tissue histology showing renal changes associated with induced colitis, and the effects of N-acetylcysteine on renal inflammation and oxidative damage markers.
Extraintestinal Manifestations in Induced Colitis: Controversial Effects of N-Acetylcysteine on Colon, Liver, …
Oxidative stress biomarkers measured in colon, liver, and kidney tissues, comparing malondialdehyde (MDA) and glutathione (GSH) levels across treatment groups.
Extraintestinal Manifestations in Induced Colitis: Controversial Effects of N-Acetylcysteine on Colon, Liver, …
Inflammatory cytokine levels (such as TNF-alpha, IL-6, or IL-1beta) in colonic and extraintestinal tissues, assessing whether NAC modulates systemic inflammation originating from the gut.
Extraintestinal Manifestations in Induced Colitis: Controversial Effects of N-Acetylcysteine on Colon, Liver, …
Colon length measurements and macroscopic damage scoring in the colitis model, providing gross anatomical evidence of disease severity and NAC treatment response.
Extraintestinal Manifestations in Induced Colitis: Controversial Effects of N-Acetylcysteine on Colon, Liver, …
Summary of controversial findings regarding NAC's differential effects across organs, with protective trends observed in some tissues but potential adverse signals in others.
Extraintestinal Manifestations in Induced Colitis: Controversial Effects of N-Acetylcysteine on Colon, Liver, …
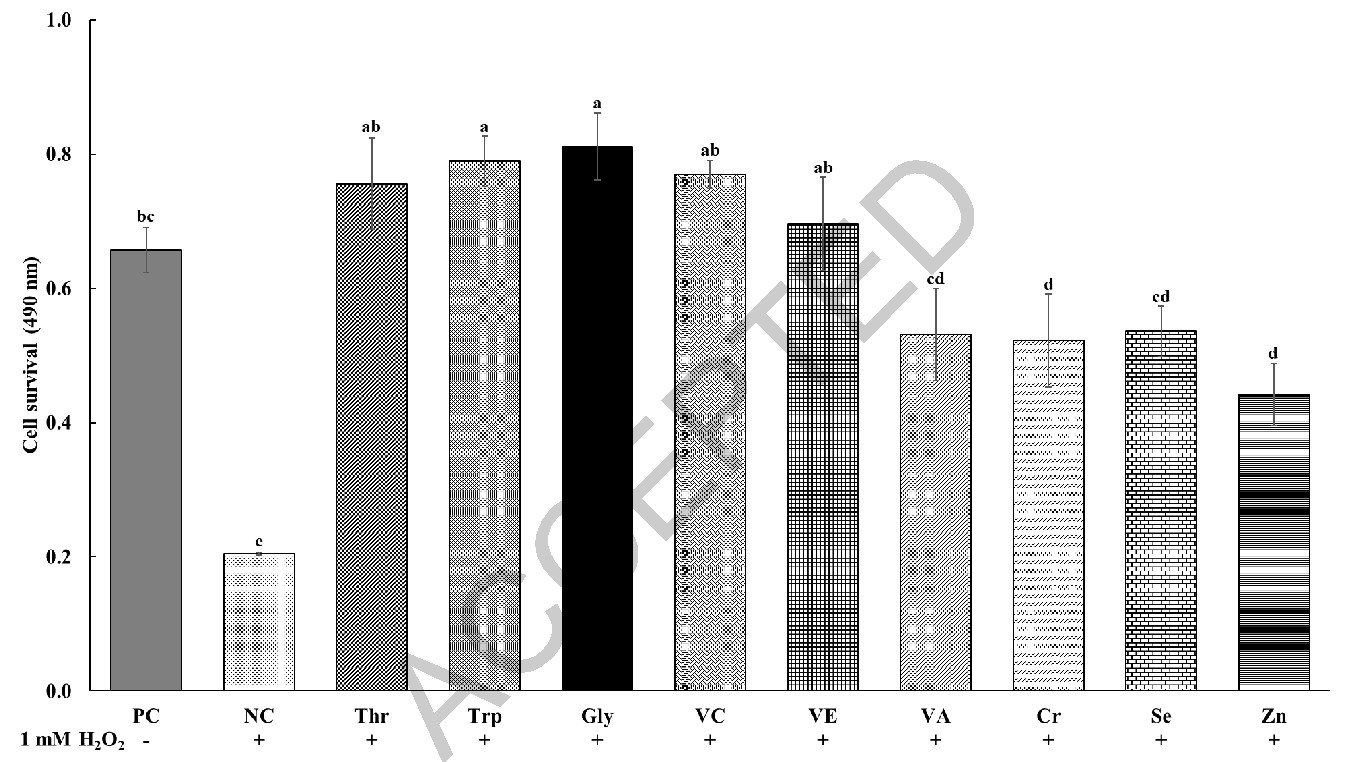
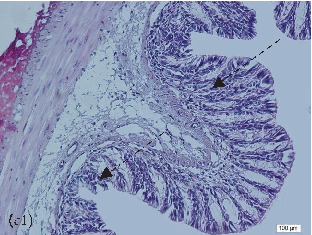
Effects of functional nutrients on chicken intestinal epithelial cells induced with oxidative …
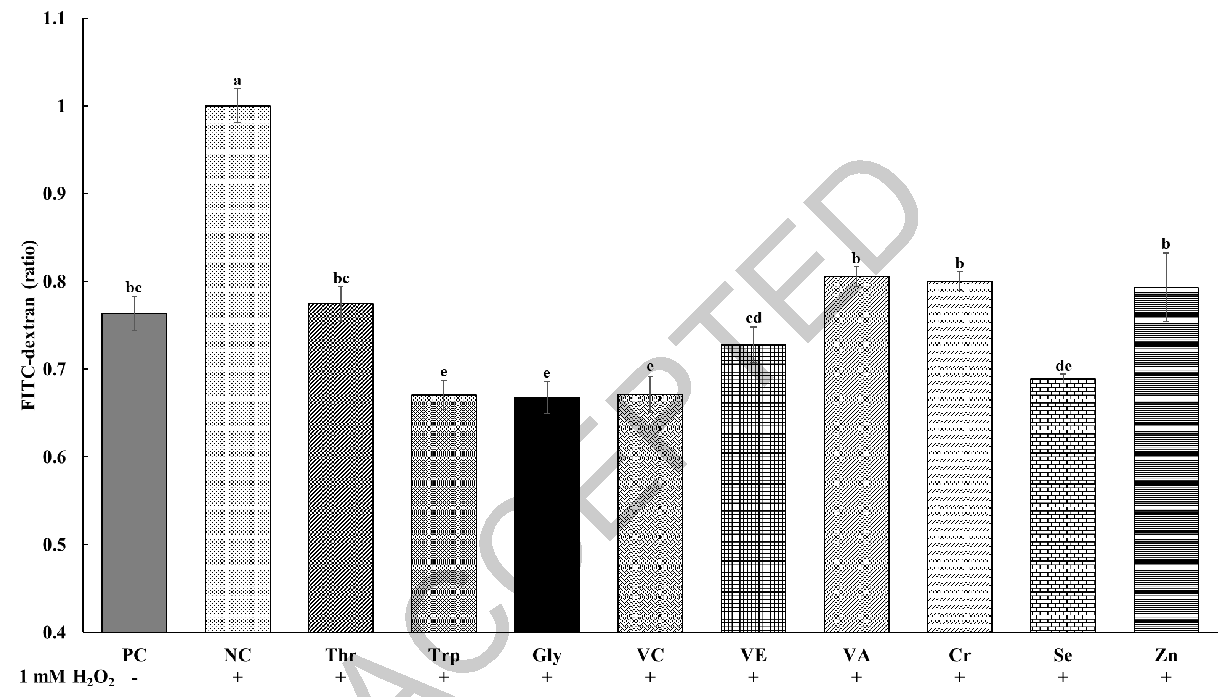
Effects of functional nutrients on chicken intestinal epithelial cells induced with oxidative …
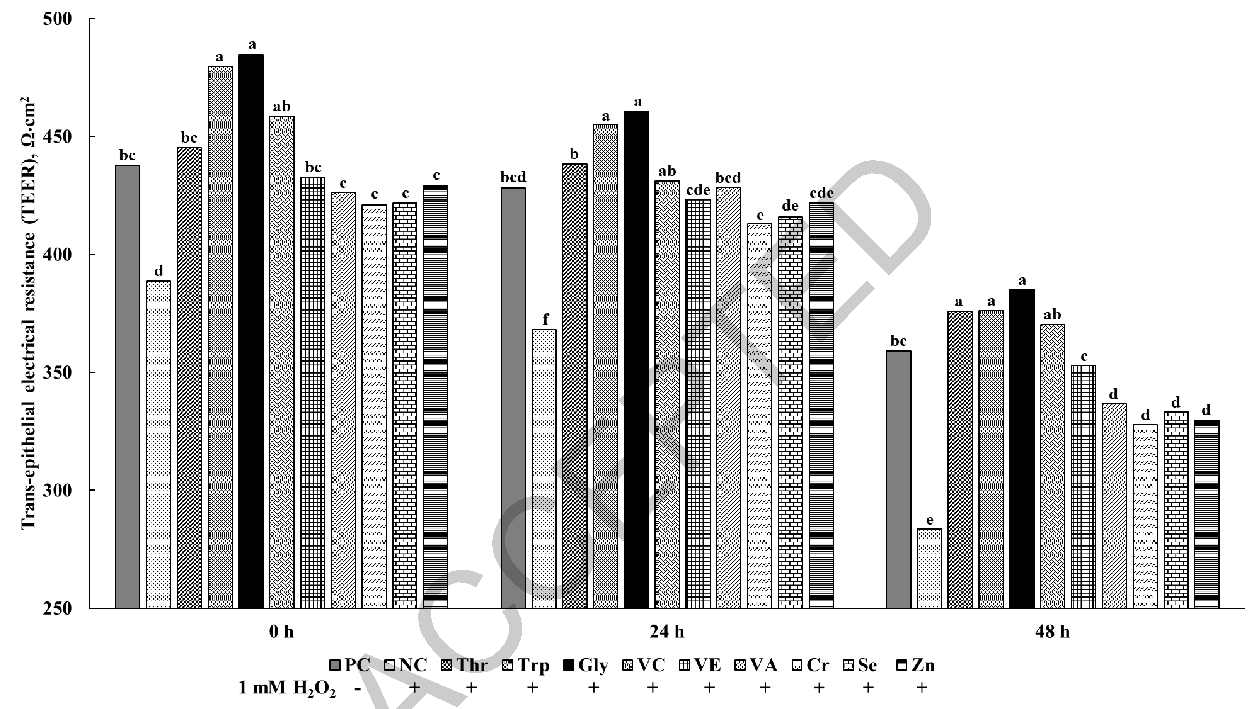
Effects of functional nutrients on chicken intestinal epithelial cells induced with oxidative …
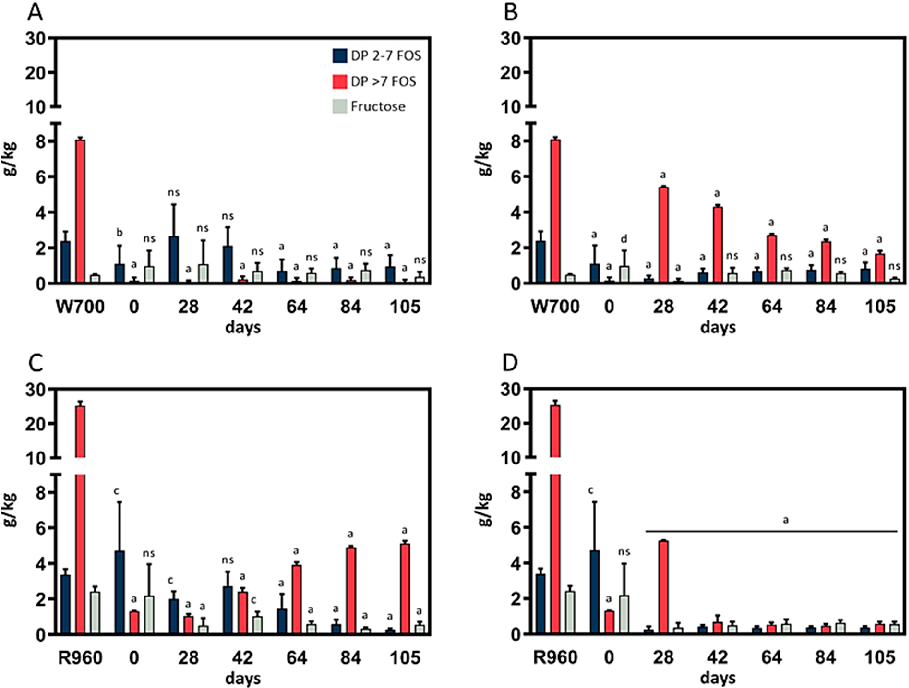
Fructose, DP 2–7 FOS, and DP >7 FOS content of sourdough (35 g water; 35 g flour). p < 0.05 (c), p < 0.01 (b), and p < 0.0001 (a) indicate significant differences from the control.
FODMAP Fingerprinting of Bakery Products and Sourdoughs: Quantitative Assessment and Content Reduction …
Statistical analysis from research investigating FODMAP Fingerprinting of Bakery Products and Sourdoughs, comparing treatment groups and control conditions.
FODMAP Fingerprinting of Bakery Products and Sourdoughs: Quantitative Assessment and Content Reduction …
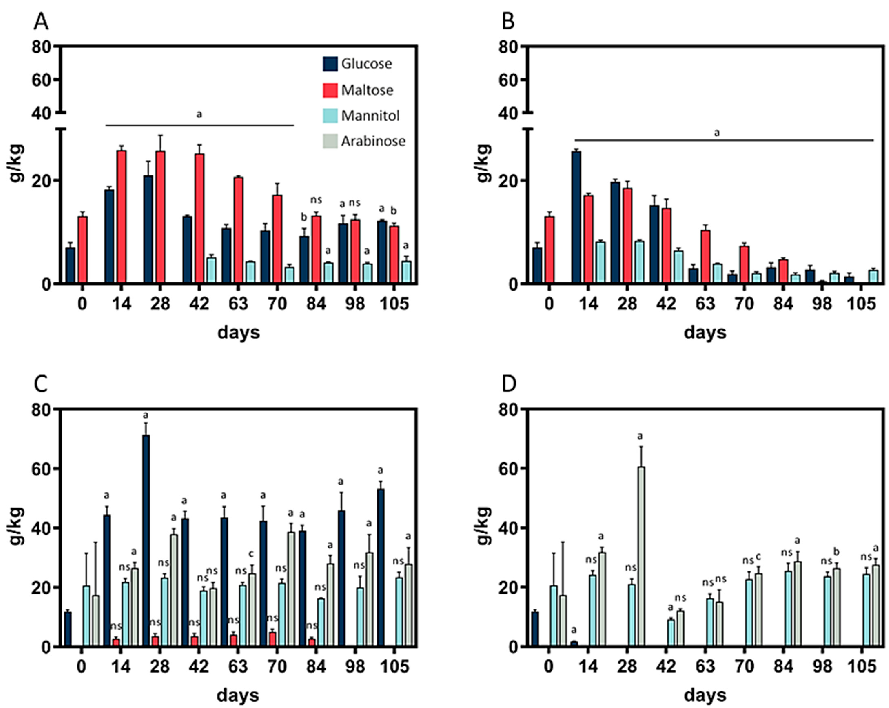
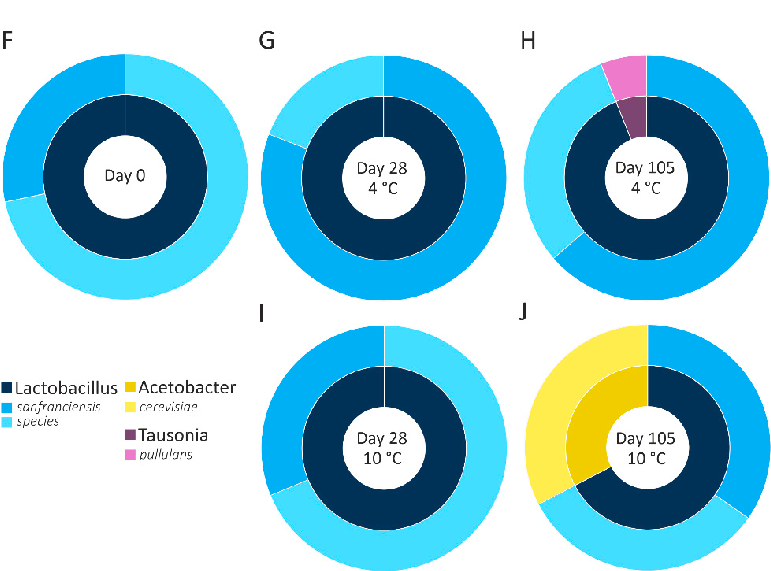
Arabinose, glucose, maltose, and mannitol contents of sourdough. (A) Wheat sourdough; 4 °C; W700.
FODMAP Fingerprinting of Bakery Products and Sourdoughs: Quantitative Assessment and Content Reduction …
Graphical representation of outcomes in a study of FODMAP Fingerprinting of Bakery Products and Sourdoughs, highlighting trends observed across experimental conditions.
FODMAP Fingerprinting of Bakery Products and Sourdoughs: Quantitative Assessment and Content Reduction …
Quantitative data from a study on FODMAP Fingerprinting of Bakery Products and Sourdoughs, presenting measured outcomes relevant to the investigation of fermentable oligo-, di-, and monosaccharides and polyols (FODMAPs) are associated with digestive disorders and with d.
FODMAP Fingerprinting of Bakery Products and Sourdoughs: Quantitative Assessment and Content Reduction …
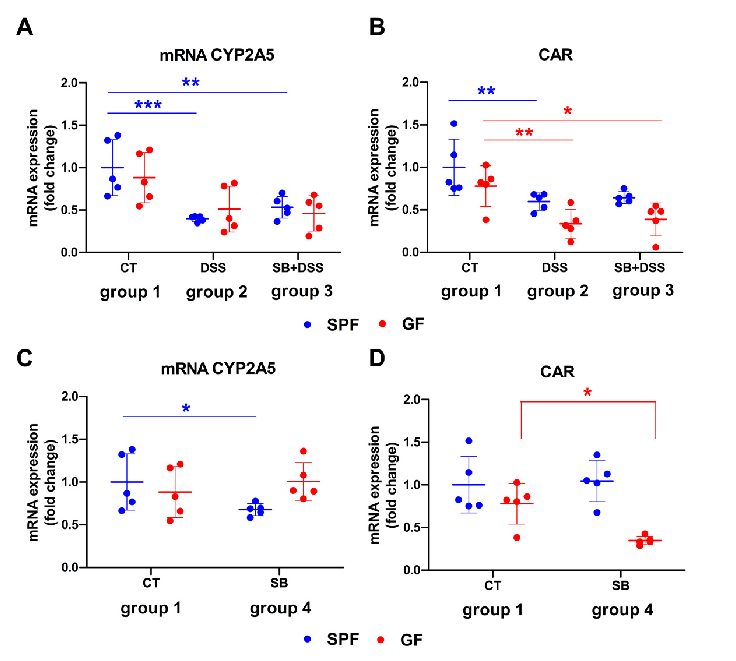
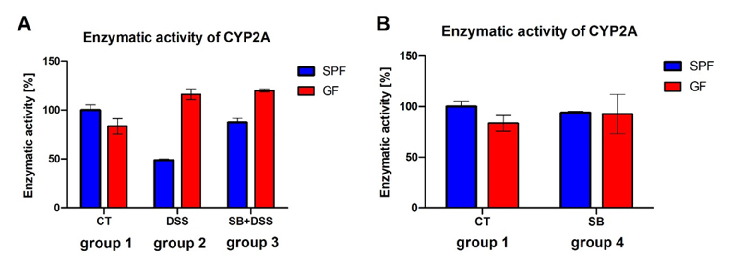
Comparison of mRNA expression of CYP2A5 and CAR in murine liver of GF and SPF mice. Gene expression of (A,C) CYP2A5 and (B,D) constitutive androstane receptor (CAR).
Effect of DSS-Induced Ulcerative Colitis and Butyrate on the Cytochrome P450 2A5: …
Statistical analysis from research investigating effect of DSS, comparing treatment groups and control conditions.
Effect of DSS-Induced Ulcerative Colitis and Butyrate on the Cytochrome P450 2A5: …
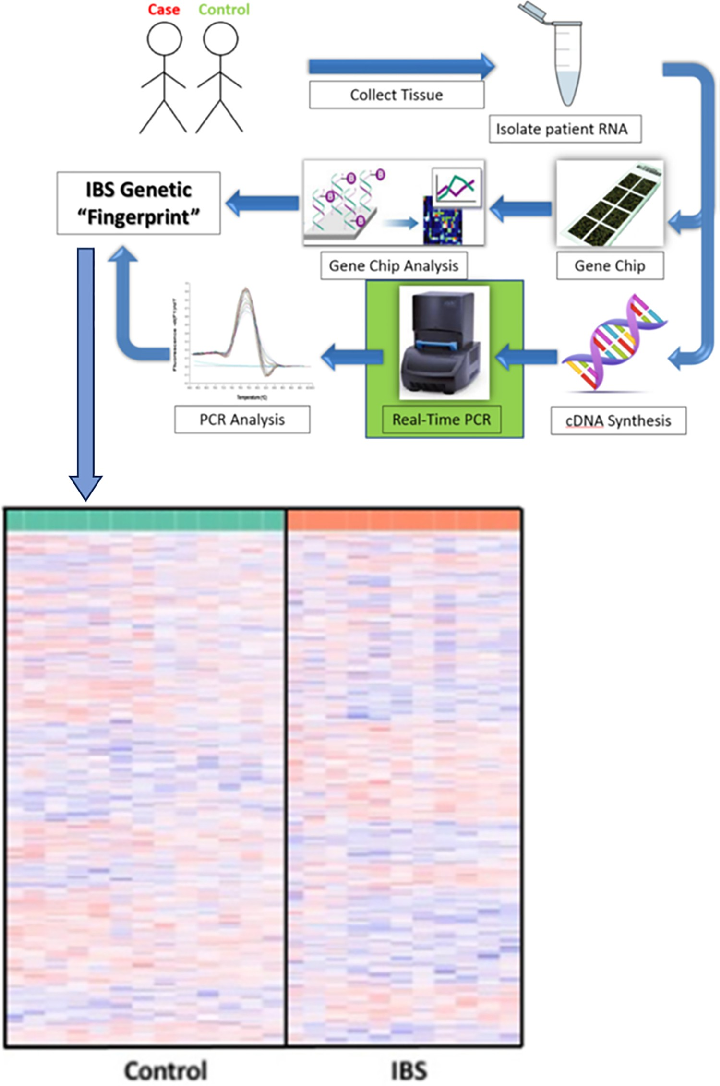
Workflow and DNA microarray analysis. Workflow in the acquisition of an IBS genetic “fingerprint” from patient sample to transcriptomic analysis.
Identification of putative transcriptomic biomarkers in irritable bowel syndrome (IBS): Differential gene …
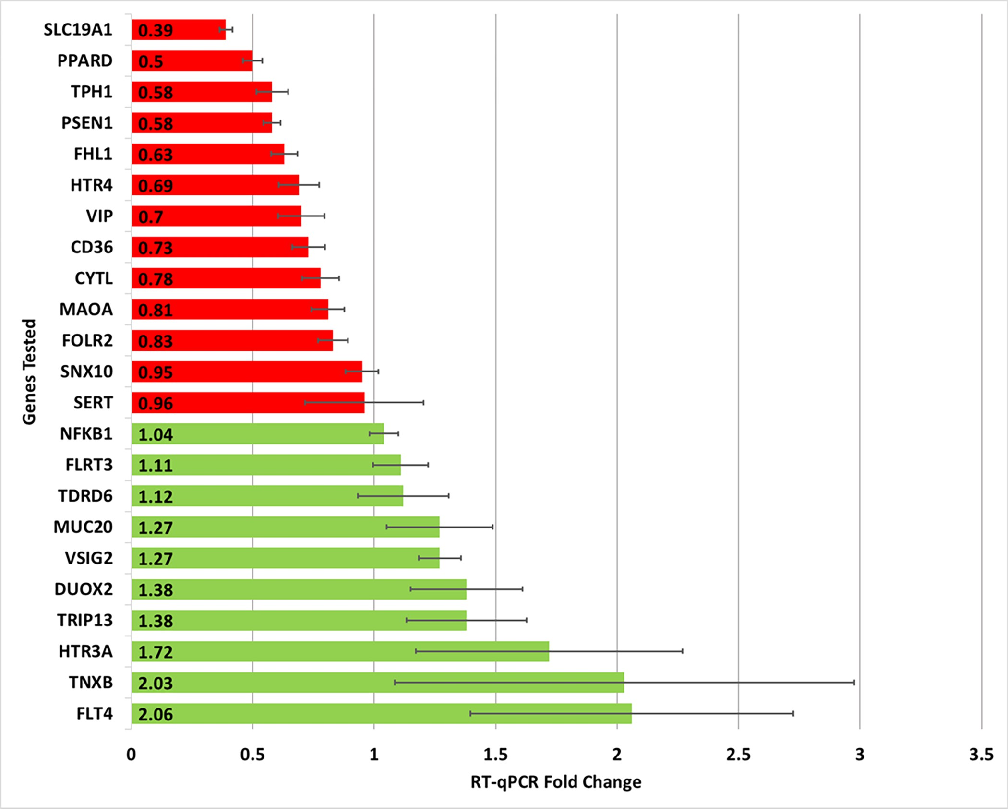
Gene expression fold change in IBS patients relative to control patients using RT-qPCR testing. In total, 29 genes of interest were evaluated with only 23 being reported here (only those genes with at least two independent RT-qPCR plate replicates are included).
Identification of putative transcriptomic biomarkers in irritable bowel syndrome (IBS): Differential gene …
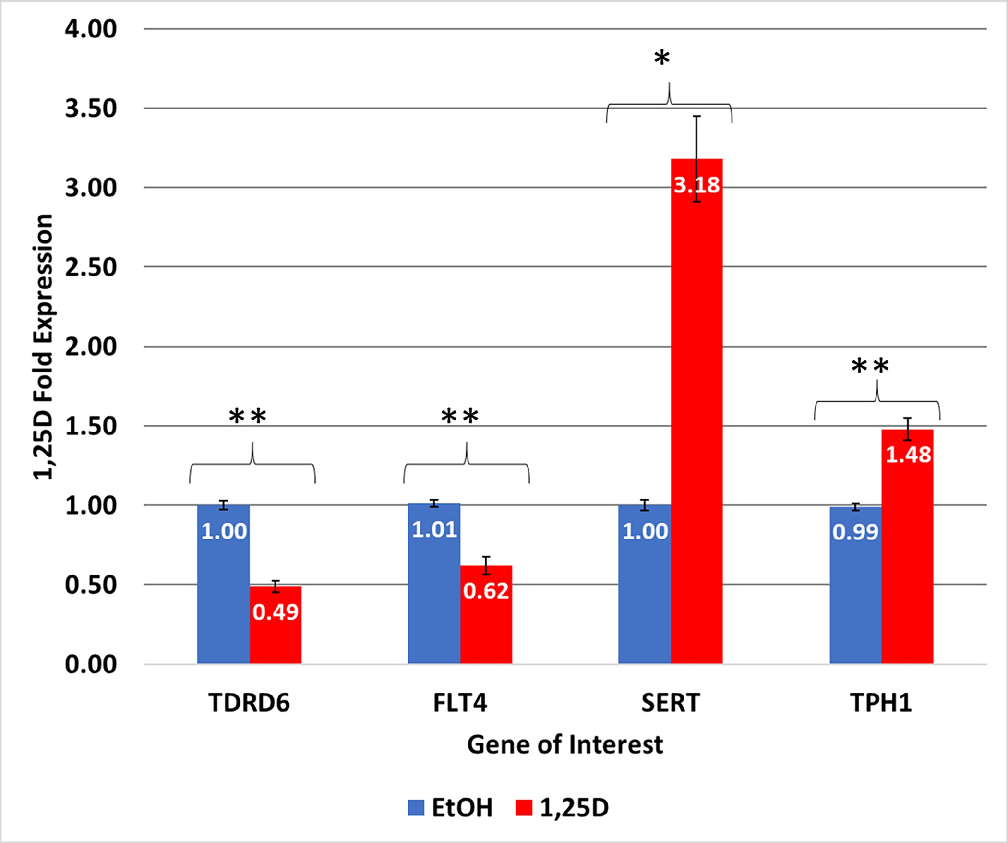
IBS-Associated gene regulation by 1,25D. The mRNA levels of each gene were determined using quantitative real-time polymerase chain reaction (RTqPCR) for a total of three to six replicates.
Identification of putative transcriptomic biomarkers in irritable bowel syndrome (IBS): Differential gene …
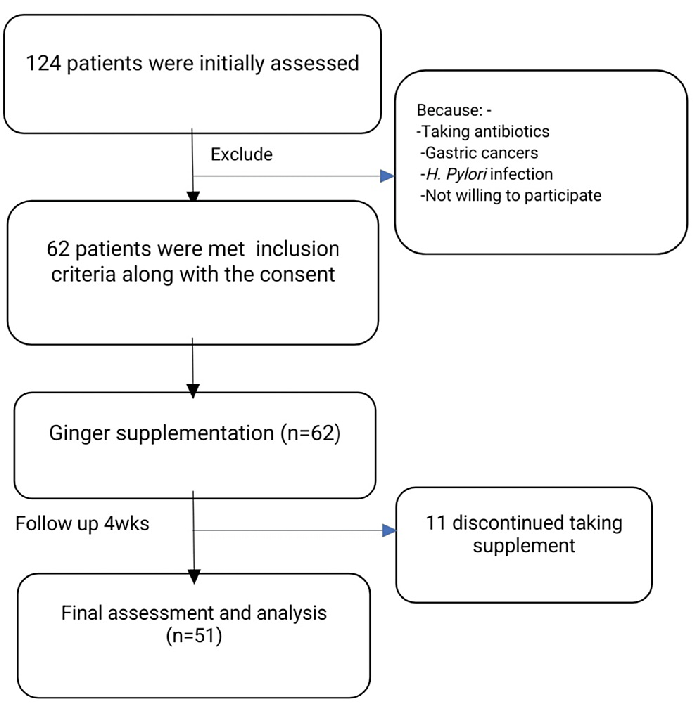
supplementation (Figure 1). The majority of the study participants were females (40/51) which represented 78.4% of the study sample.
The Effect of Ginger Supplementation on the Improvement of Dyspeptic Symptoms in …
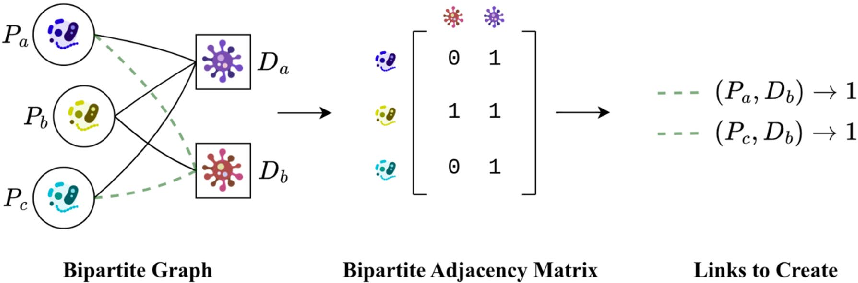
Experimental results examining computational prediction of new therapeutic effects of probiotics, with data points illustrating key findings related to probiotics are living microorganisms that provide health benefits to their hosts, potentially aiding in the treatment.
Computational prediction of new therapeutic effects of probiotics.
20ページ中14ページ目