Fructooligosaccharides (FOS) 図
12 査読済み研究からの図表
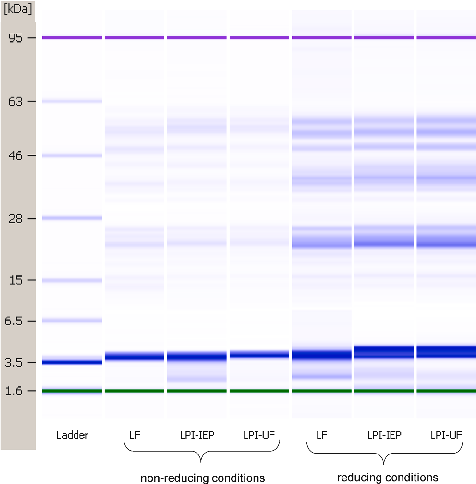
Gel-like electrophoresis images compare the protein molecular weight distribution of lentil protein sources under reducing and non-reducing conditions, revealing the impact of processing methods on protein subunit composition.
Nutritional and anti-nutritional properties of lentil (Lens culinaris) protein isolates prepared by …
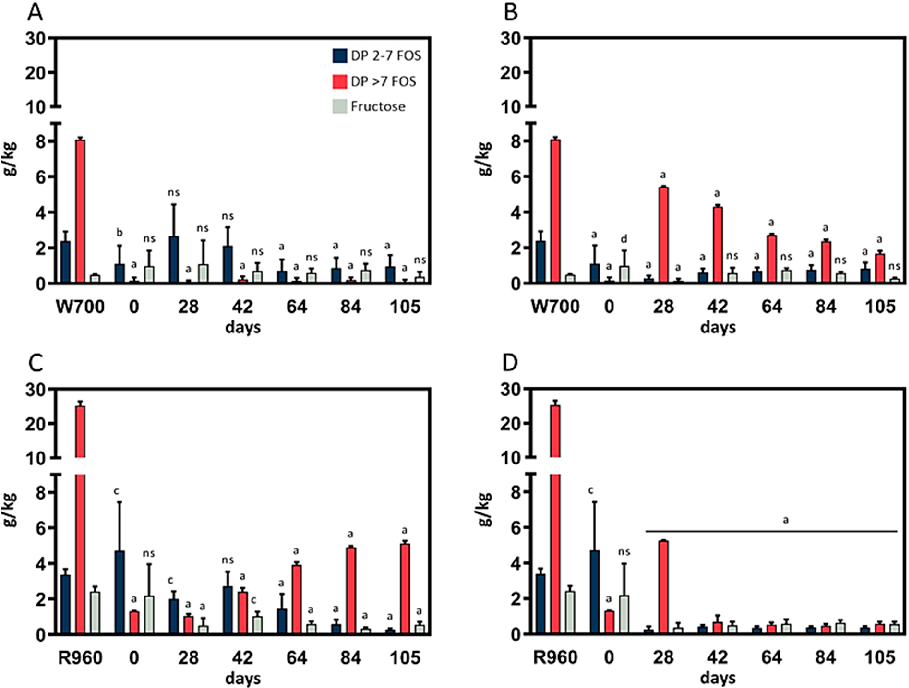
Fructose, DP 2–7 FOS, and DP >7 FOS content of sourdough (35 g water; 35 g flour). p < 0.05 (c), p < 0.01 (b), and p < 0.0001 (a) indicate significant differences from the control.
FODMAP Fingerprinting of Bakery Products and Sourdoughs: Quantitative Assessment and Content Reduction …
Statistical analysis from research investigating FODMAP Fingerprinting of Bakery Products and Sourdoughs, comparing treatment groups and control conditions.
FODMAP Fingerprinting of Bakery Products and Sourdoughs: Quantitative Assessment and Content Reduction …
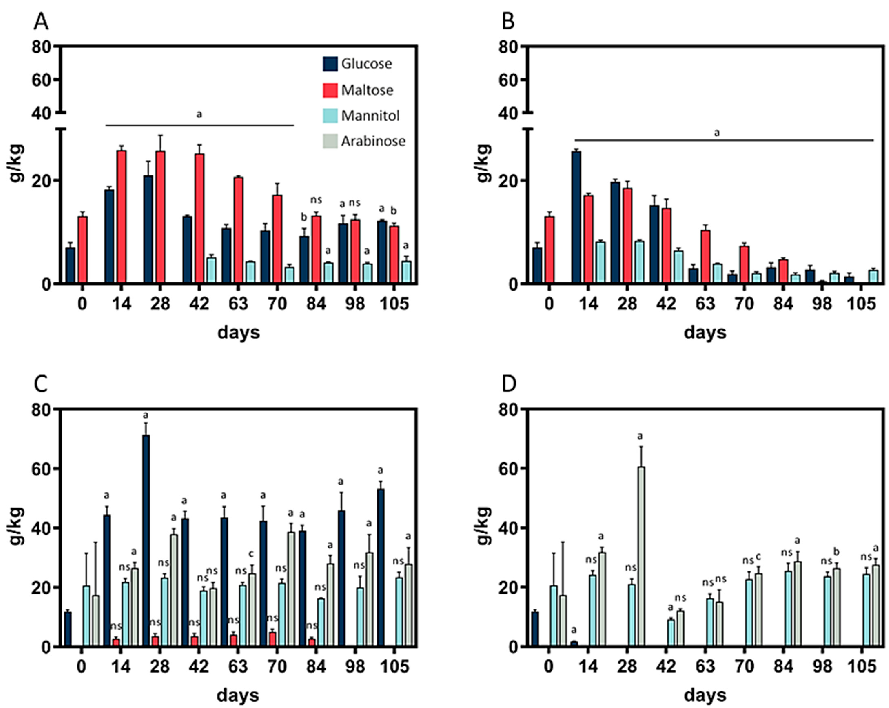
Arabinose, glucose, maltose, and mannitol contents of sourdough. (A) Wheat sourdough; 4 °C; W700.
FODMAP Fingerprinting of Bakery Products and Sourdoughs: Quantitative Assessment and Content Reduction …
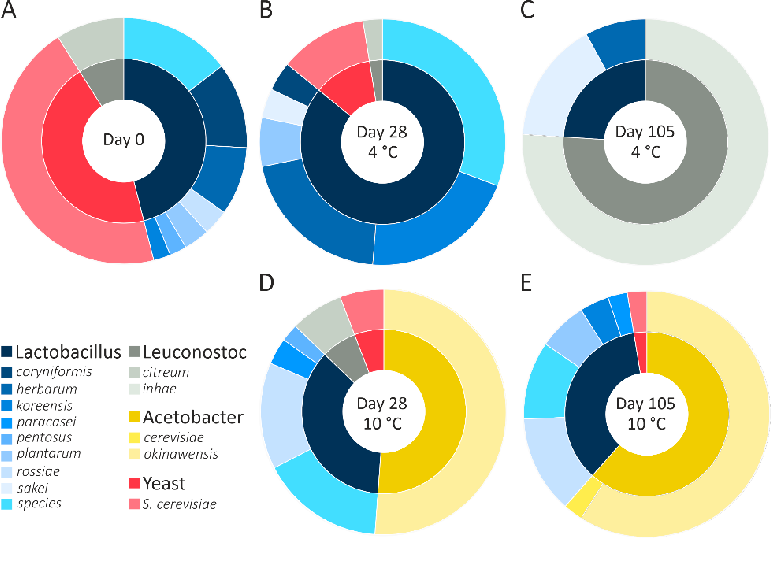
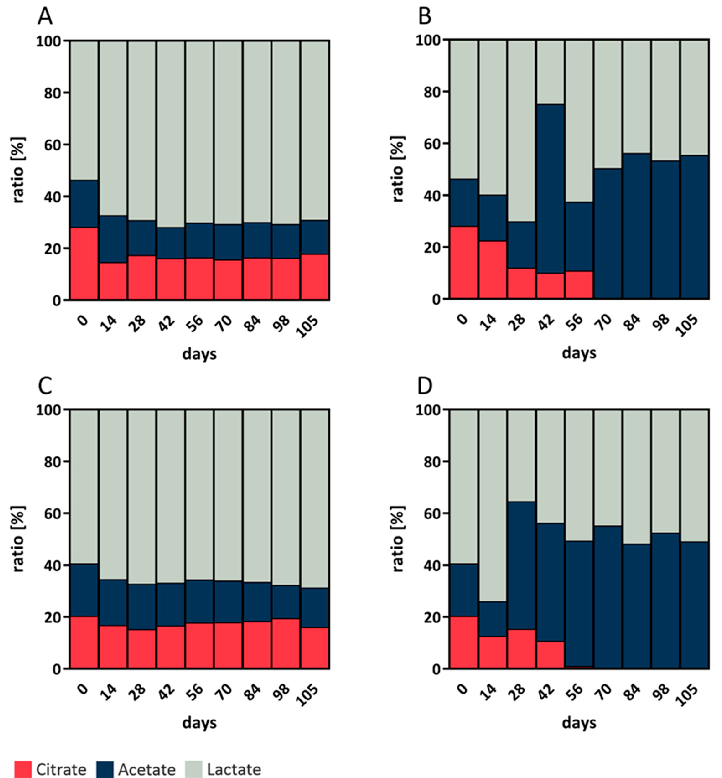
Graphical representation of outcomes in a study of FODMAP Fingerprinting of Bakery Products and Sourdoughs, highlighting trends observed across experimental conditions.
FODMAP Fingerprinting of Bakery Products and Sourdoughs: Quantitative Assessment and Content Reduction …
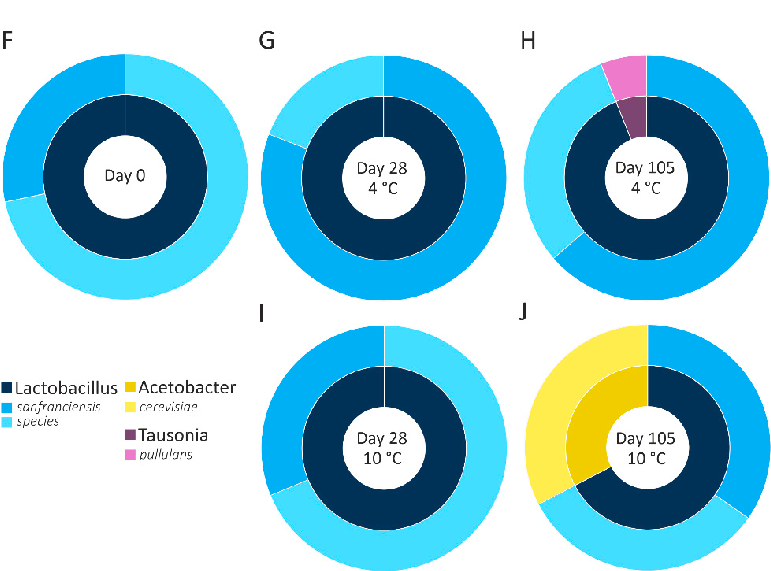
Quantitative data from a study on FODMAP Fingerprinting of Bakery Products and Sourdoughs, presenting measured outcomes relevant to the investigation of fermentable oligo-, di-, and monosaccharides and polyols (FODMAPs) are associated with digestive disorders and with d.
FODMAP Fingerprinting of Bakery Products and Sourdoughs: Quantitative Assessment and Content Reduction …
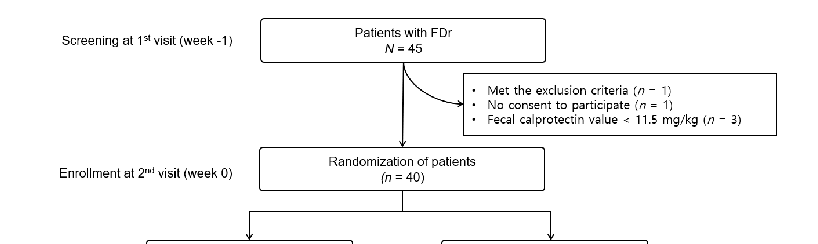
A Randomized, Double-Blind, Placebo-Controlled Trial to Evaluate the Effects of Multi-Strain Synbiotic …
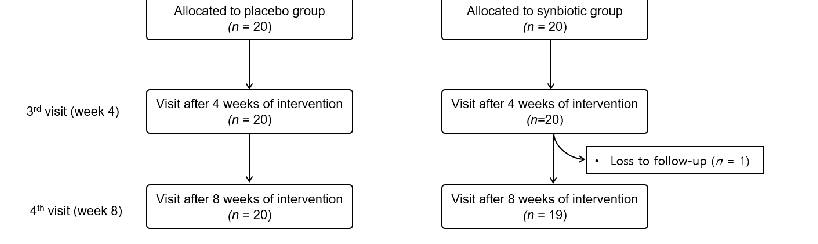
Figure 1. Flow diagram showing the selection of subjects for this study. FDr, functional diarrhea.
A Randomized, Double-Blind, Placebo-Controlled Trial to Evaluate the Effects of Multi-Strain Synbiotic …
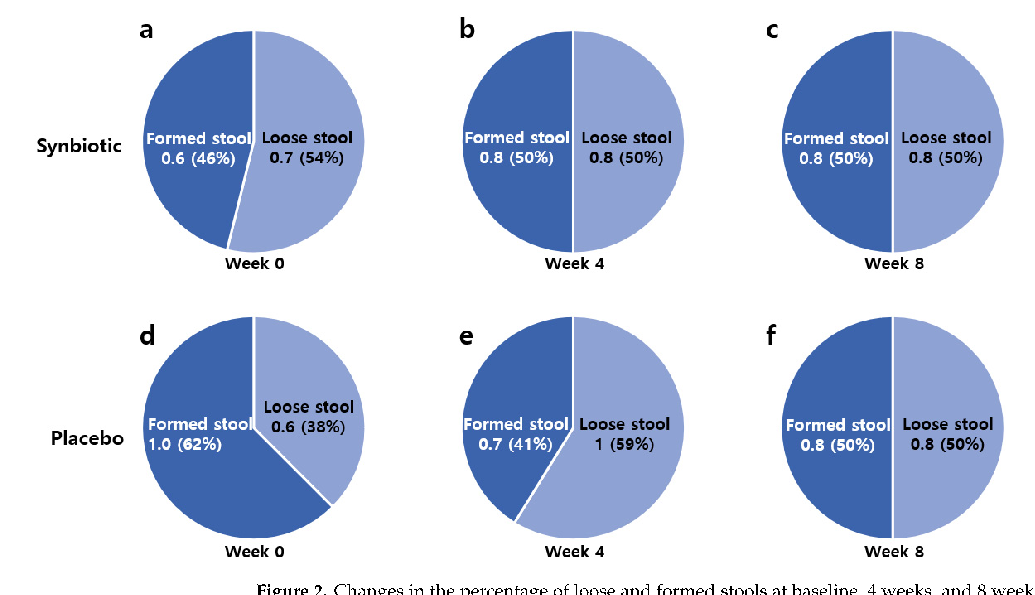
Figure 2. Changes in the percentage of loose and formed stools at baseline, 4 weeks, and 8 weeks after intervention. Changes in the proportion of formed and loose stools at …
A Randomized, Double-Blind, Placebo-Controlled Trial to Evaluate the Effects of Multi-Strain Synbiotic …
A Randomized, Double-Blind, Placebo-Controlled Trial to Evaluate the Effects of Multi-Strain Synbiotic …
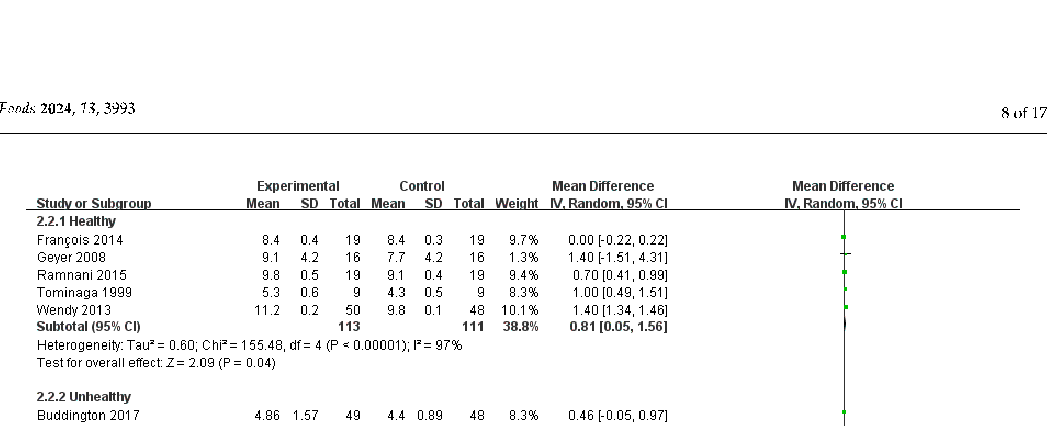
Fructooligosaccharides for Relieving Functional Constipation: A Systematic Review and Meta-Analysis of Randomized …
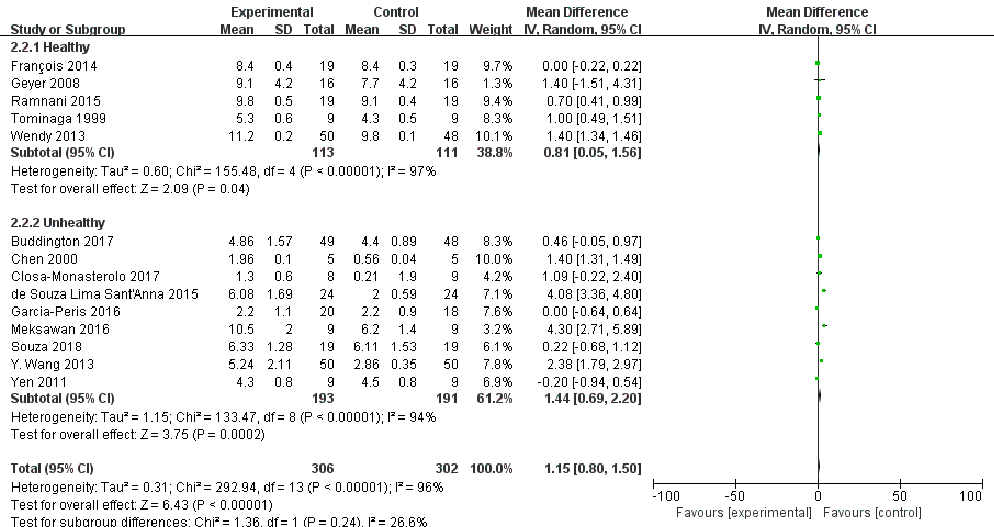
Fructooligosaccharides for Relieving Functional Constipation: A Systematic Review and Meta-Analysis of Randomized …