Processo di ricerca
477 figure da ricerca revisionata da esperti
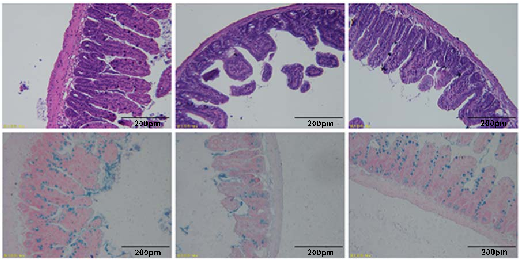
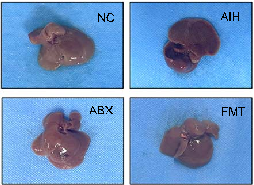
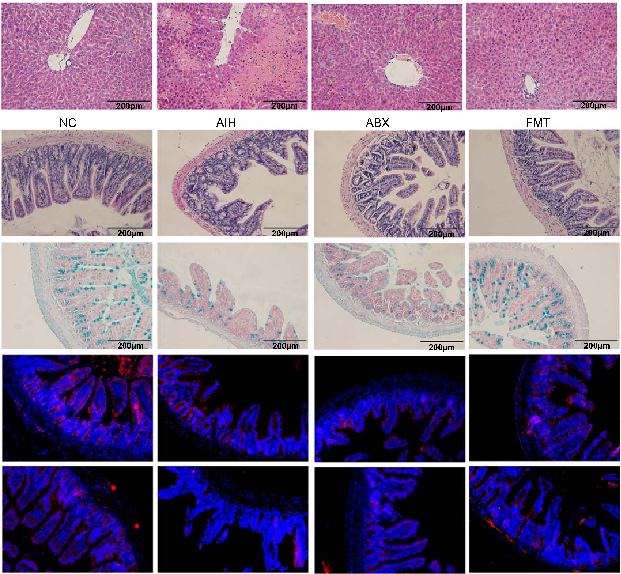
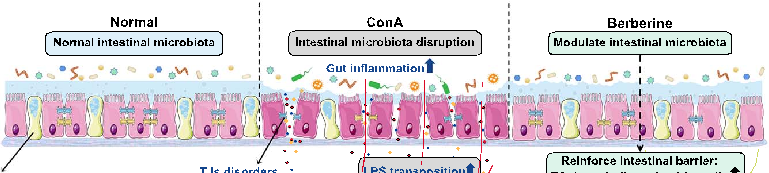
Extended analysis from the berberine autoimmune hepatitis study, examining molecular pathways or additional biomarkers related to gut-liver axis communication and intestinal barrier function.
Berberine alleviates concanavalin A-induced autoimmune hepatitis in mice by modulating the gut …
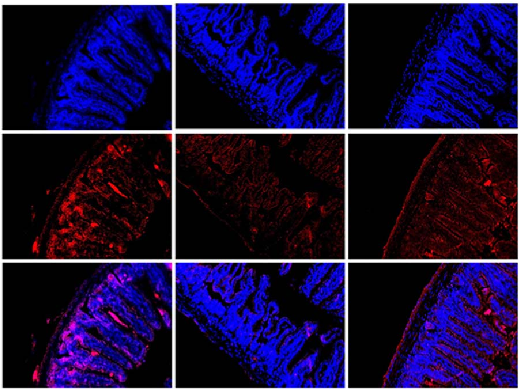
Extended analysis from the berberine autoimmune hepatitis study, examining molecular pathways or additional biomarkers related to gut-liver axis communication and intestinal barrier function.
Berberine alleviates concanavalin A-induced autoimmune hepatitis in mice by modulating the gut …
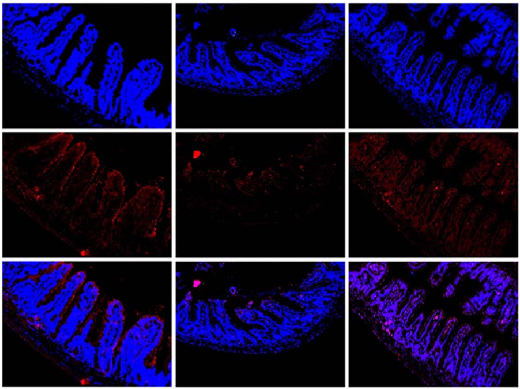
Extended analysis from the berberine autoimmune hepatitis study, examining molecular pathways or additional biomarkers related to gut-liver axis communication and intestinal barrier function.
Berberine alleviates concanavalin A-induced autoimmune hepatitis in mice by modulating the gut …
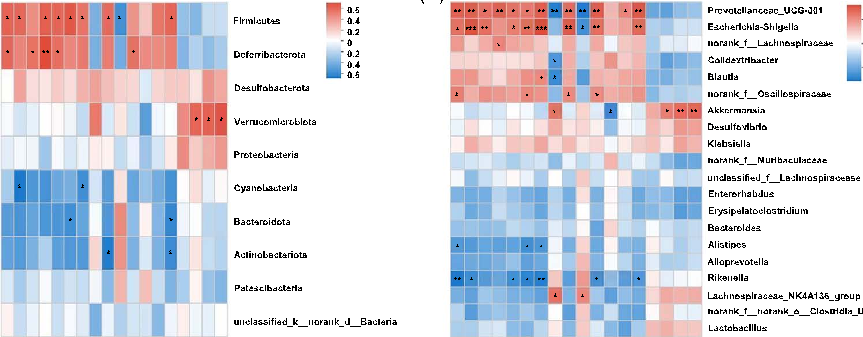
Gut microbiota sequencing or metabolomic data from the berberine-treated autoimmune hepatitis model, characterizing microbial community shifts and their potential functional implications.
Berberine alleviates concanavalin A-induced autoimmune hepatitis in mice by modulating the gut …
Gut microbiota sequencing or metabolomic data from the berberine-treated autoimmune hepatitis model, characterizing microbial community shifts and their potential functional implications.
Berberine alleviates concanavalin A-induced autoimmune hepatitis in mice by modulating the gut …
Gut microbiota sequencing or metabolomic data from the berberine-treated autoimmune hepatitis model, characterizing microbial community shifts and their potential functional implications.
Berberine alleviates concanavalin A-induced autoimmune hepatitis in mice by modulating the gut …
Additional supplementary data from the comprehensive berberine autoimmune hepatitis study, further supporting the connection between gut microbiota modulation and liver inflammation resolution.
Berberine alleviates concanavalin A-induced autoimmune hepatitis in mice by modulating the gut …
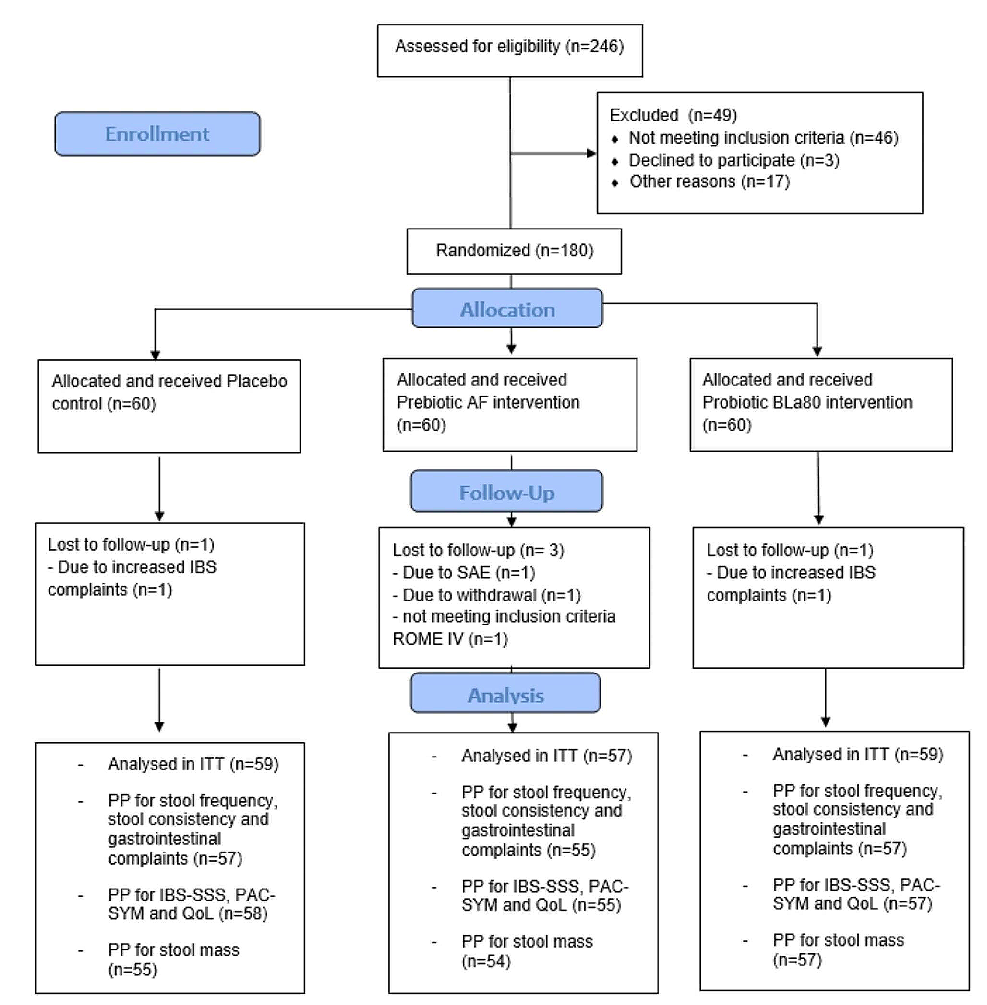
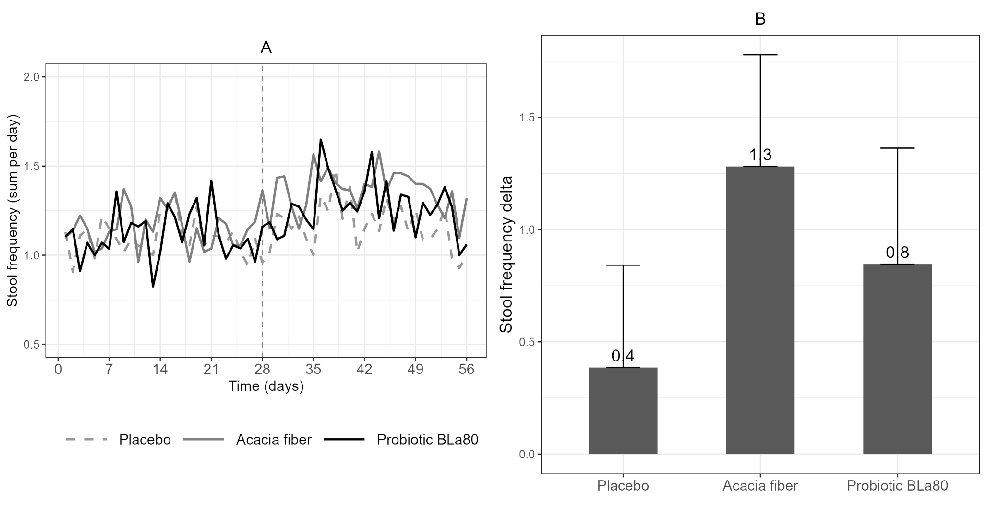
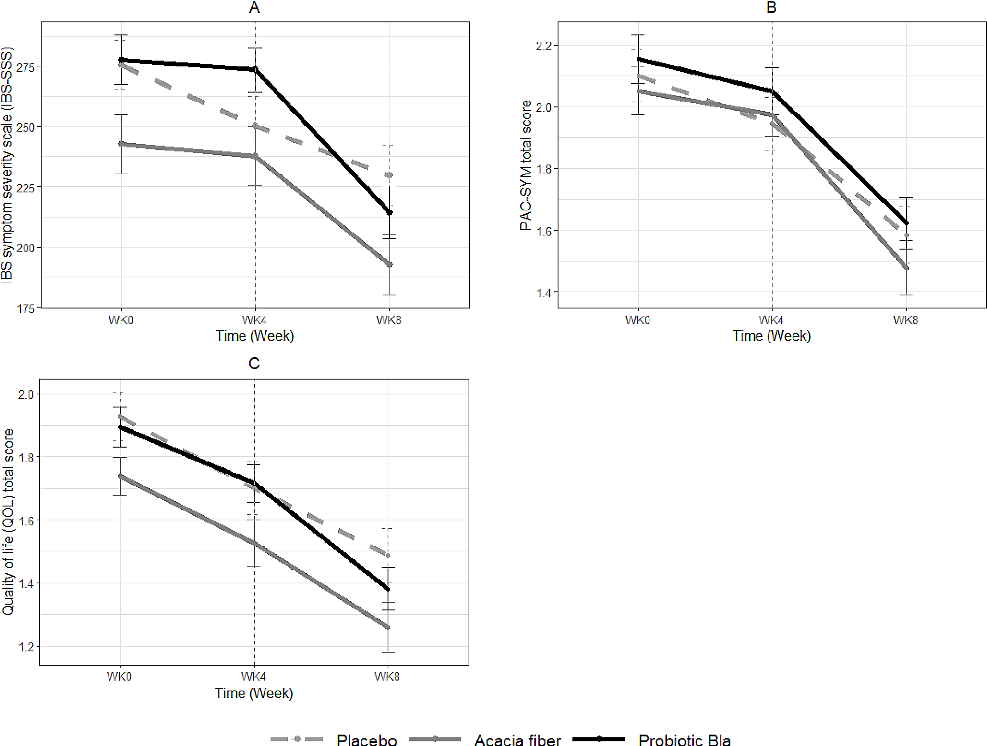
Clinical outcome data from a trial comparing acacia fiber and probiotic Bifidobacterium lactis (Bla80) supplementation for relieving gastrointestinal complaints in adult participants.
Acacia fiber or probiotic supplements to relieve gastrointestinal complaints in patients with …
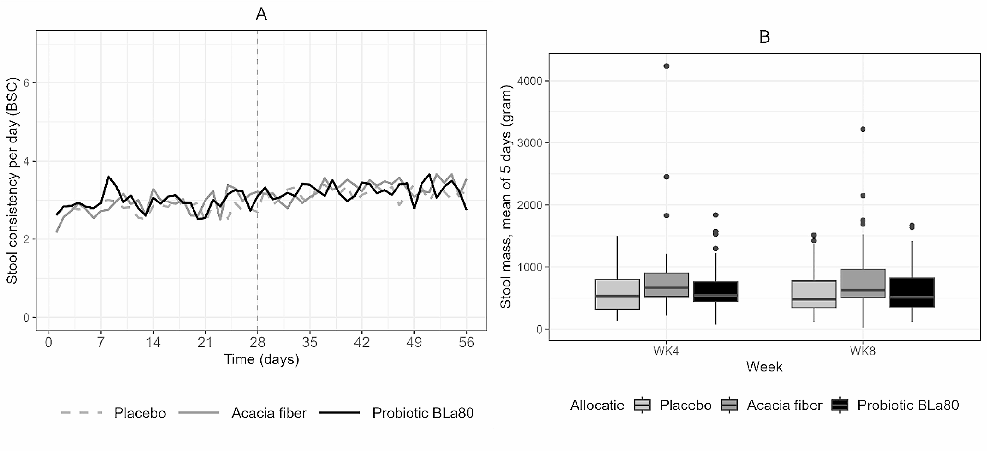
Stool mass measurements before and after intervention with acacia fiber or probiotic Bifidobacterium lactis (Bla80) for gastrointestinal complaints, comparing changes between treatment groups.
Acacia fiber or probiotic supplements to relieve gastrointestinal complaints in patients with …
Stool mass measurements before and after intervention with acacia fiber or probiotic Bifidobacterium lactis (Bla80) for gastrointestinal complaints, comparing changes between treatment groups.
Acacia fiber or probiotic supplements to relieve gastrointestinal complaints in patients with …
Longitudinal gastrointestinal symptom tracking during the acacia fiber and probiotic Bifidobacterium lactis intervention trial, with the vertical dashed line marking the transition from baseline to active treatment.
Acacia fiber or probiotic supplements to relieve gastrointestinal complaints in patients with …
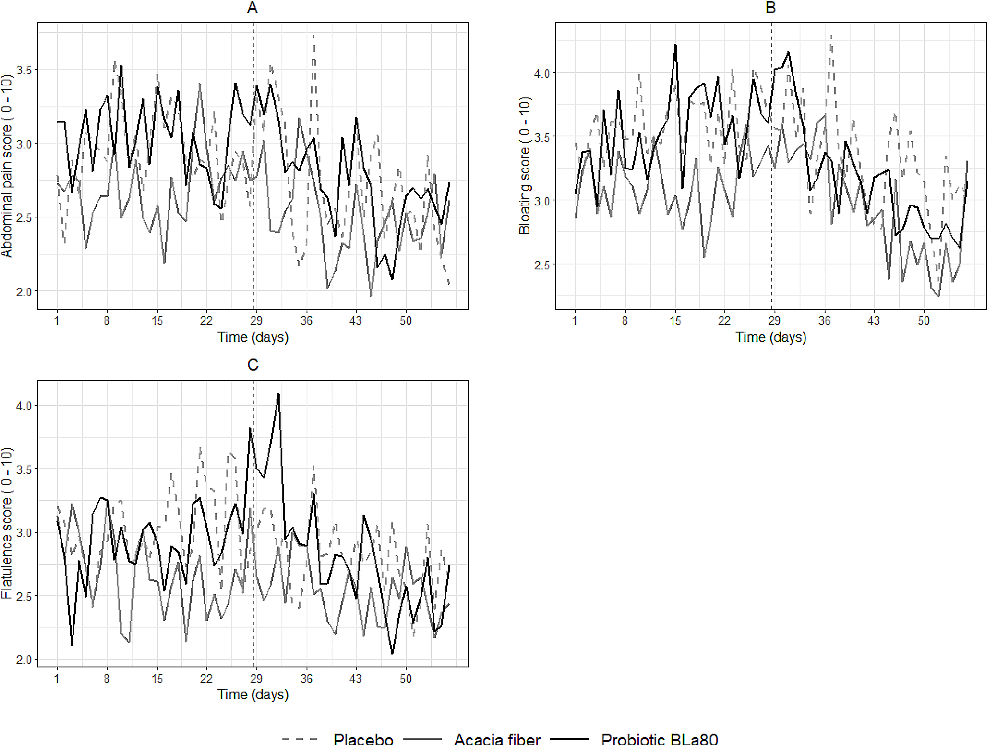
Daily symptom data spanning the run-in period (days 1-28) and intervention period (days 29-56) for placebo, prebiotic acacia fiber, and probiotic Bifidobacterium lactis groups in the gastrointestinal complaint trial.
Acacia fiber or probiotic supplements to relieve gastrointestinal complaints in patients with …
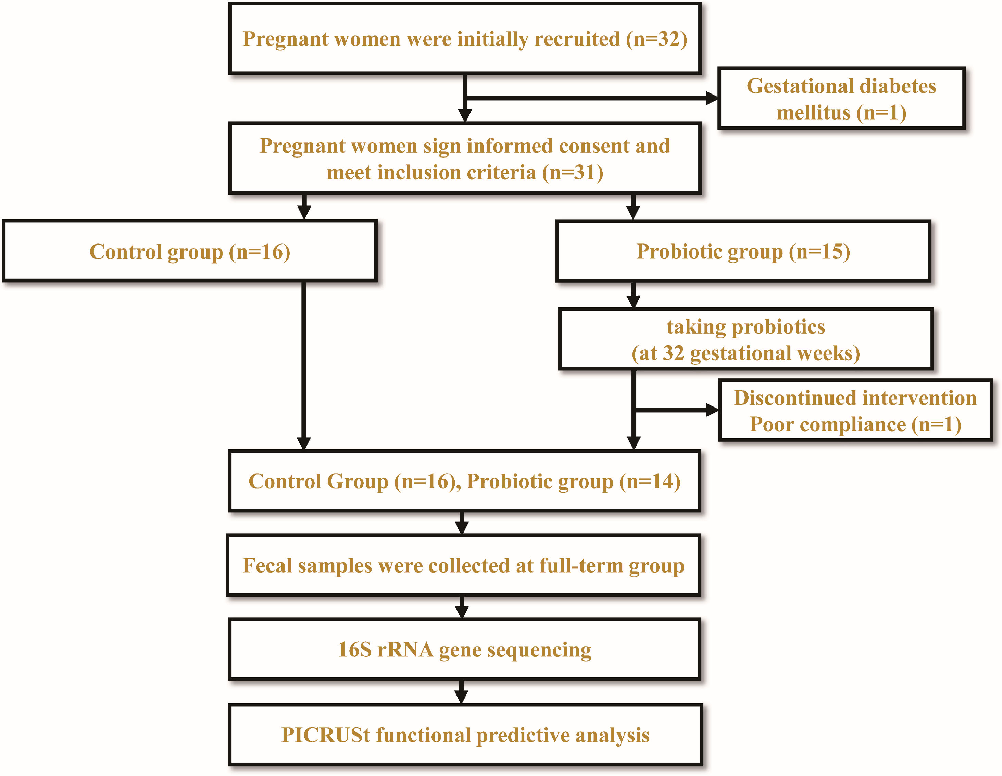
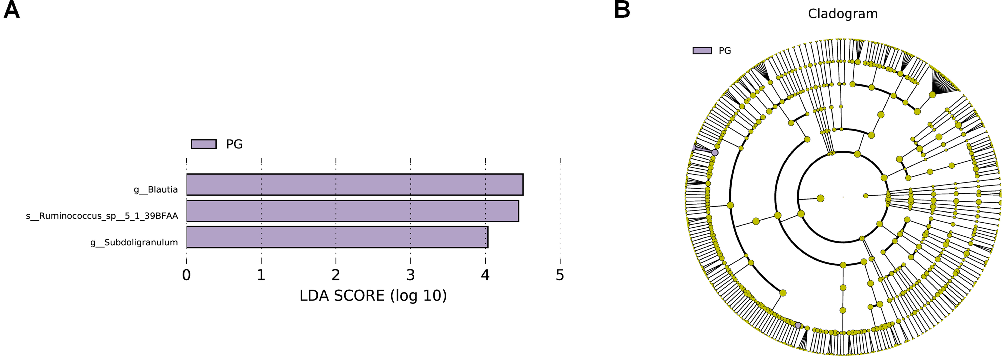
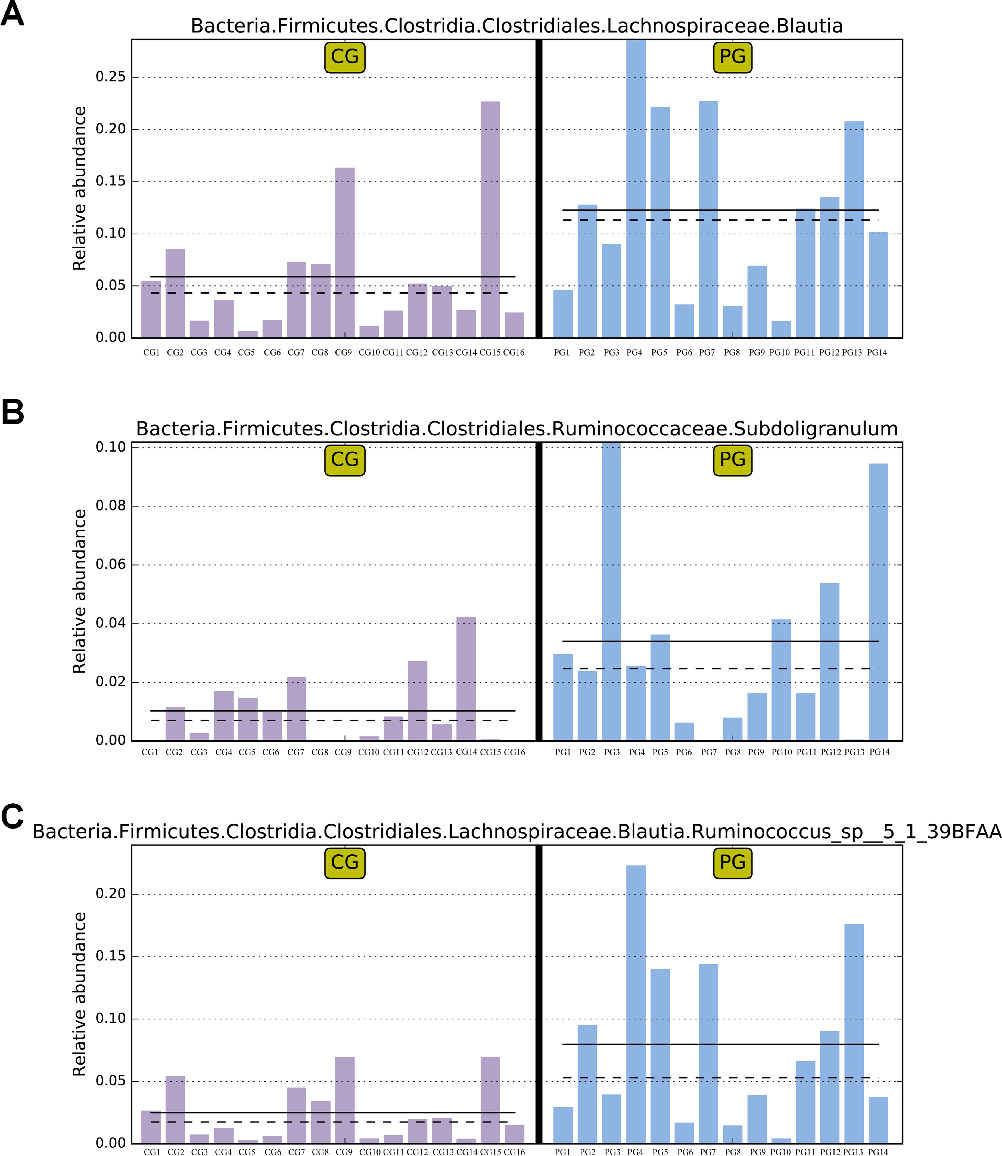
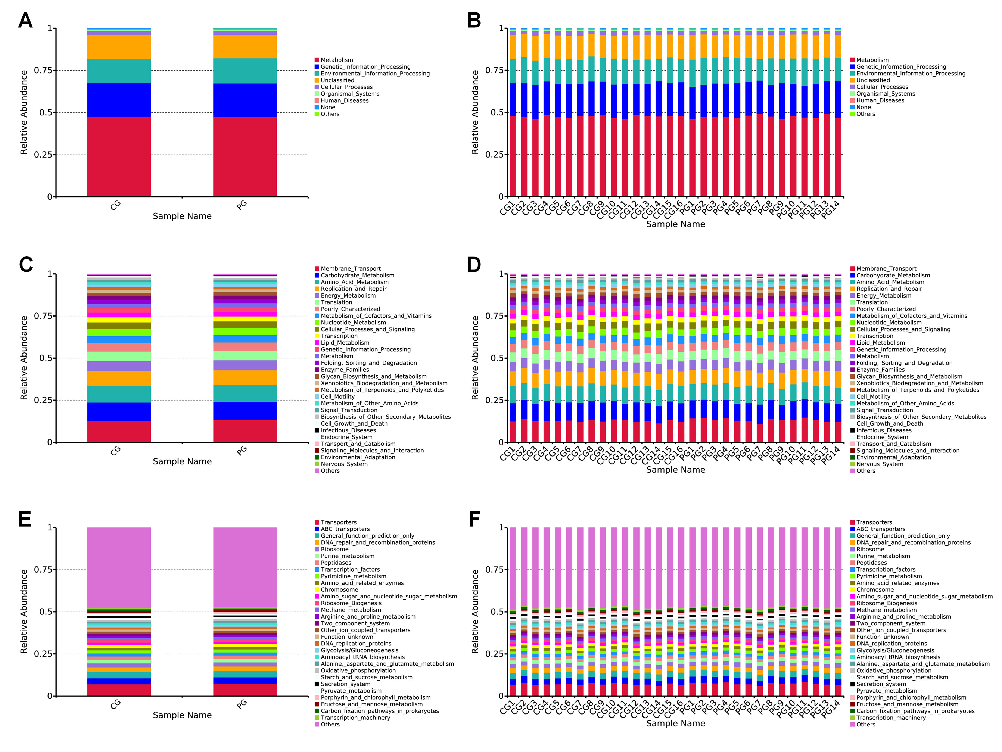
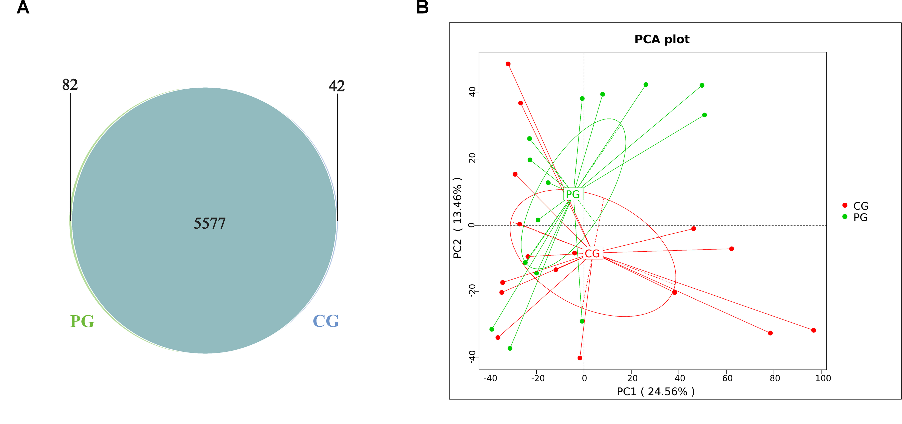
Gut microbiota diversity analysis from pregnant women receiving probiotic supplementation, assessing changes in microbial community composition and functional capacity.
Effect of probiotic administration during pregnancy on the functional diversity of the …
Gut microbiota diversity analysis from pregnant women receiving probiotic supplementation, assessing changes in microbial community composition and functional capacity.
Effect of probiotic administration during pregnancy on the functional diversity of the …
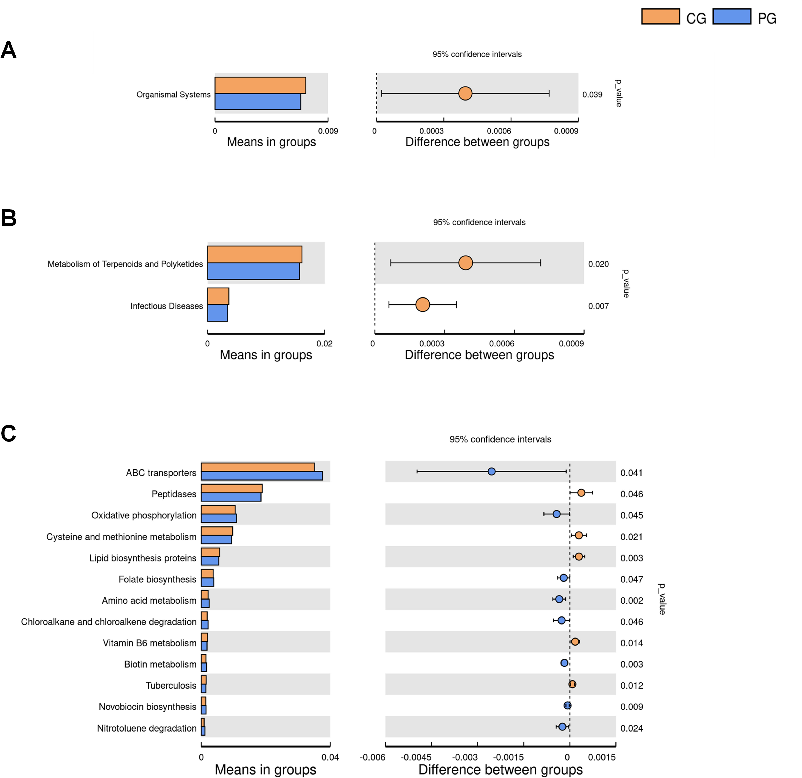
Extended microbiome analysis data from the pregnancy probiotic trial, examining functional diversity shifts in the gut microbiota of mothers and their offspring.
Effect of probiotic administration during pregnancy on the functional diversity of the …
Extended microbiome analysis data from the pregnancy probiotic trial, examining functional diversity shifts in the gut microbiota of mothers and their offspring.
Effect of probiotic administration during pregnancy on the functional diversity of the …
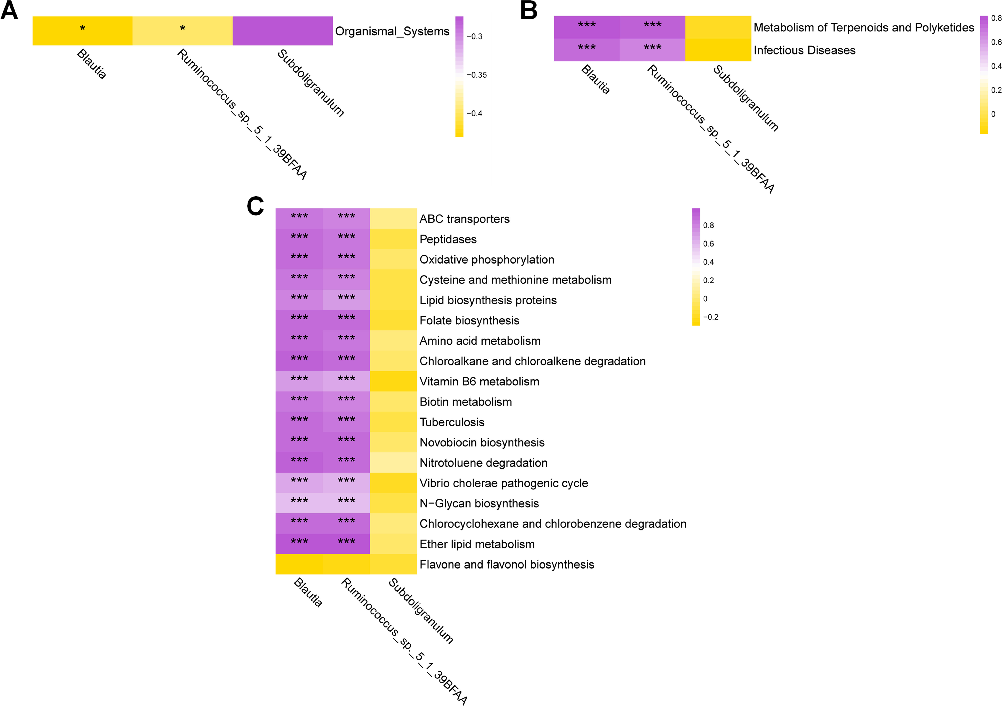
Extended microbiome analysis data from the pregnancy probiotic trial, examining functional diversity shifts in the gut microbiota of mothers and their offspring.
Effect of probiotic administration during pregnancy on the functional diversity of the …
Extended microbiome analysis data from the pregnancy probiotic trial, examining functional diversity shifts in the gut microbiota of mothers and their offspring.
Effect of probiotic administration during pregnancy on the functional diversity of the …
Extended microbiome analysis data from the pregnancy probiotic trial, examining functional diversity shifts in the gut microbiota of mothers and their offspring.
Effect of probiotic administration during pregnancy on the functional diversity of the …
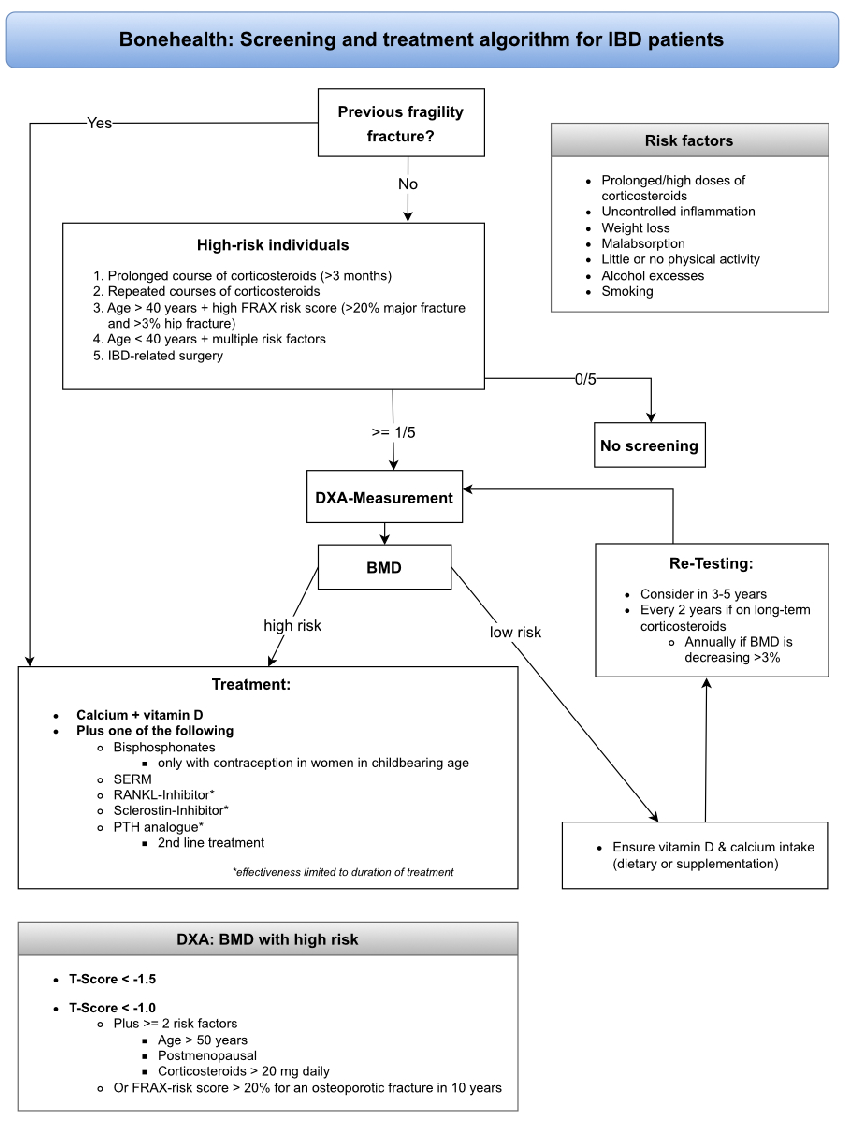
Figure 1 : The screening and treatment algorithm for patients with IBD regarding bone health. This algorithm summarises and simplifies the above screening recommendations and is intended as a practical …
Bone health in patients with inflammatory bowel disease.
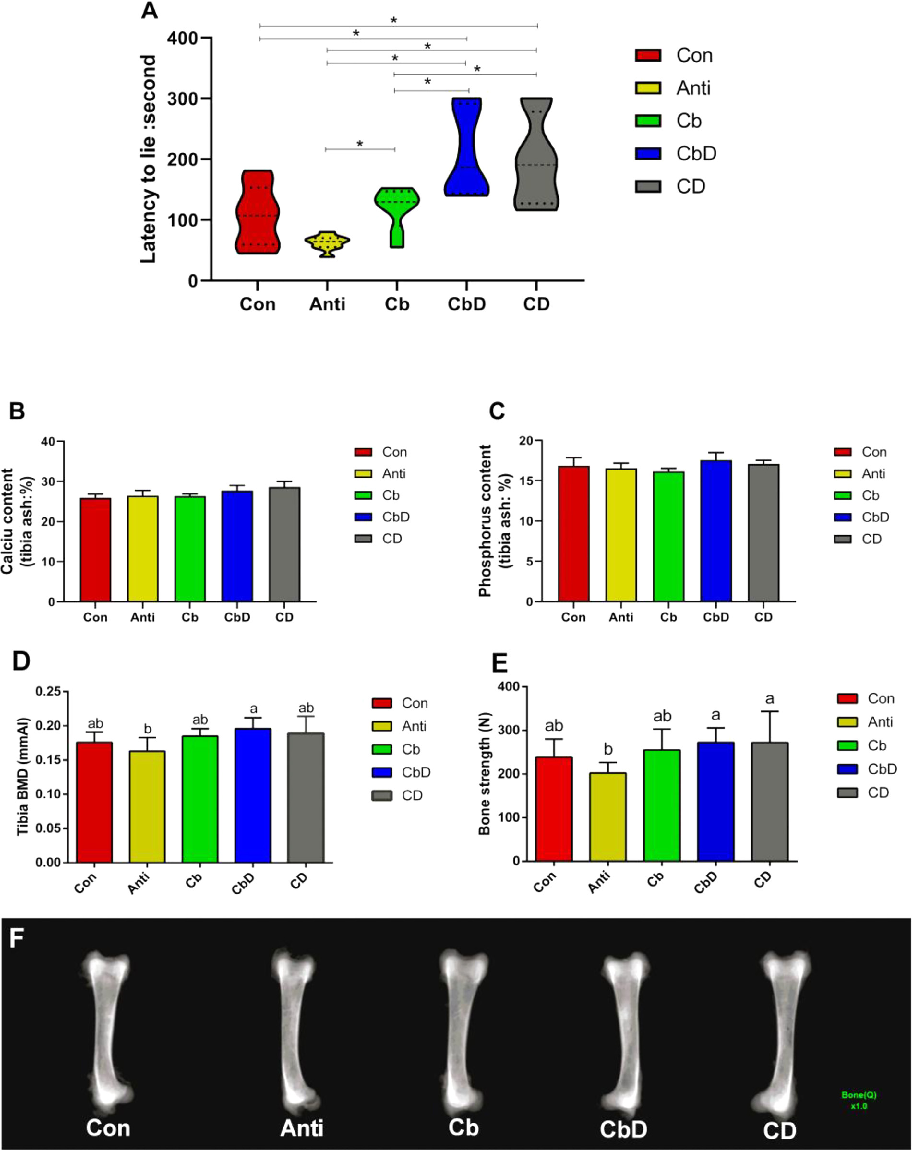
Effects of dietary Clostridium butyricum and 25-hydroxyvitamin D3 supplementation on latency-to-lie time in a poultry model, indicating improvements in leg health and bone strength.
Dietary Clostridium butyricum and 25-Hydroxyvitamin D3 modulate bone metabolism of broilers through …
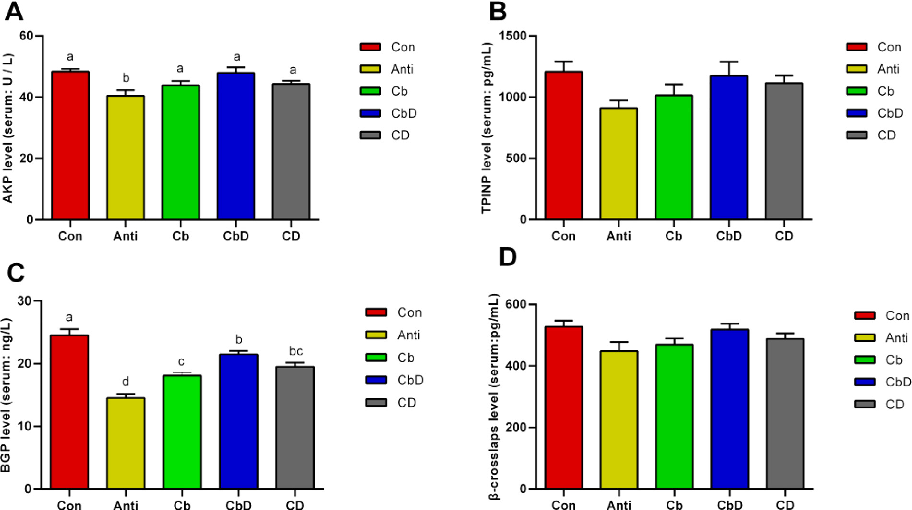
Experimental data from a study on dietary Clostridium butyricum and 25-hydroxyvitamin D3 and their combined effects on bone metabolism through gut microbiota modulation in poultry.
Dietary Clostridium butyricum and 25-Hydroxyvitamin D3 modulate bone metabolism of broilers through …
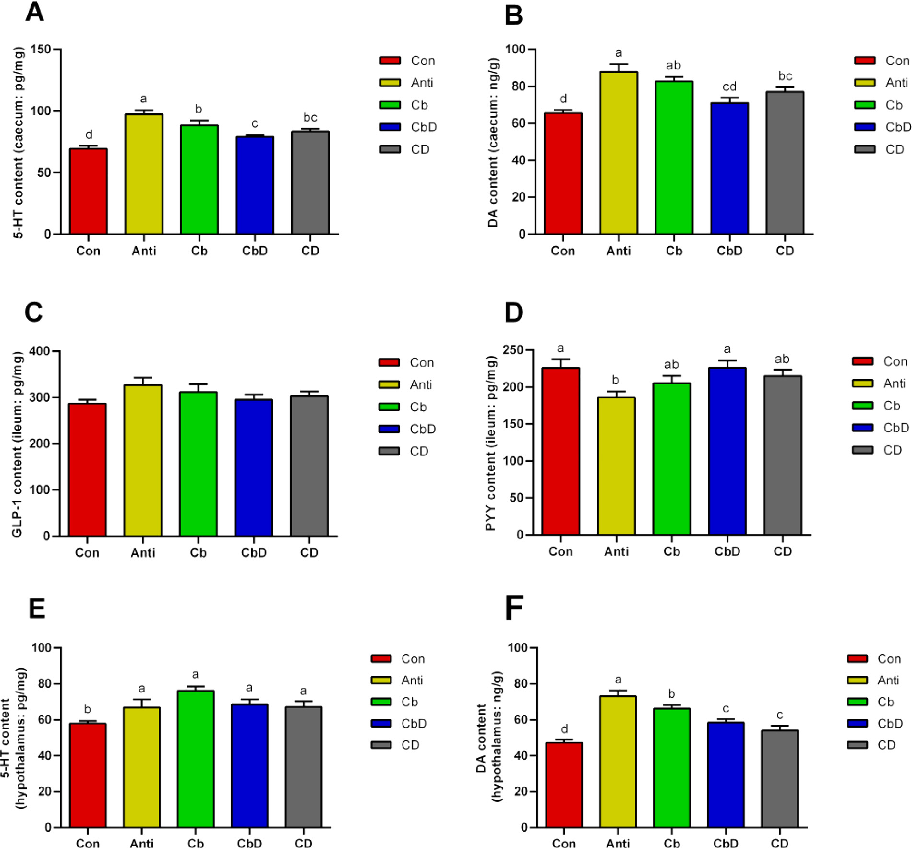
Hypothalamic signaling pathway analysis in poultry fed Clostridium butyricum and 25-hydroxyvitamin D3, examining effects on bone metabolism regulatory mechanisms.
Dietary Clostridium butyricum and 25-Hydroxyvitamin D3 modulate bone metabolism of broilers through …
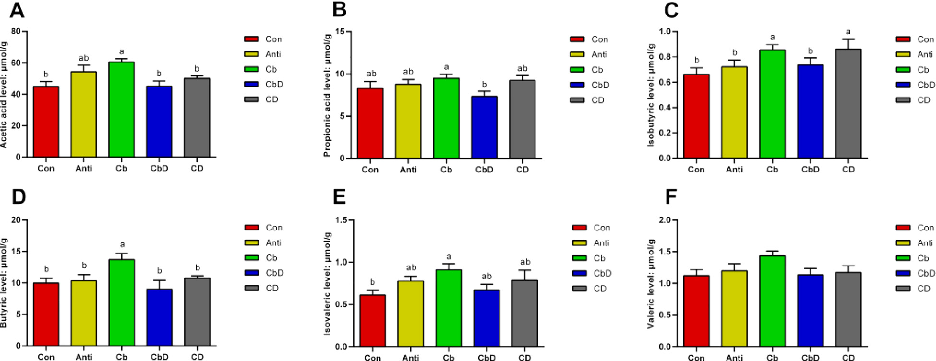
Caecal short-chain fatty acid (SCFA) concentrations in poultry supplemented with Clostridium butyricum and 25-hydroxyvitamin D3, linking gut fermentation products to bone metabolism modulation.
Dietary Clostridium butyricum and 25-Hydroxyvitamin D3 modulate bone metabolism of broilers through …
Pagina 16 di 20