Inulin Figures
49 figures from peer-reviewed research
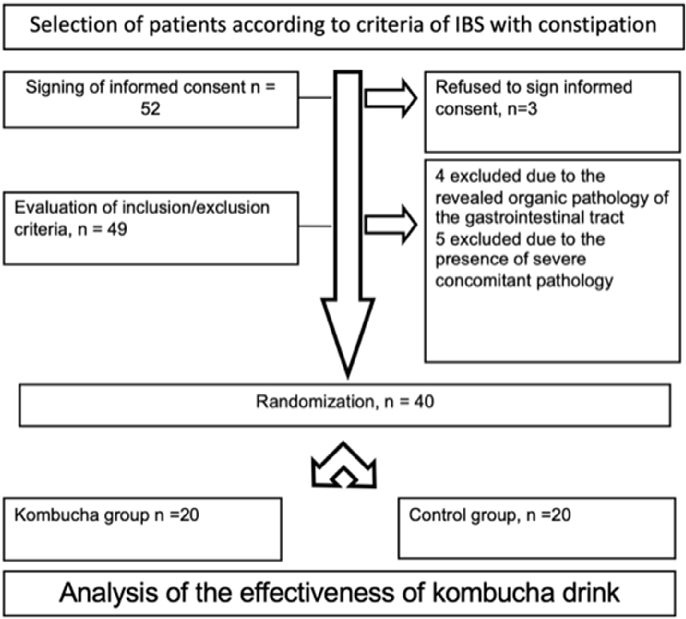
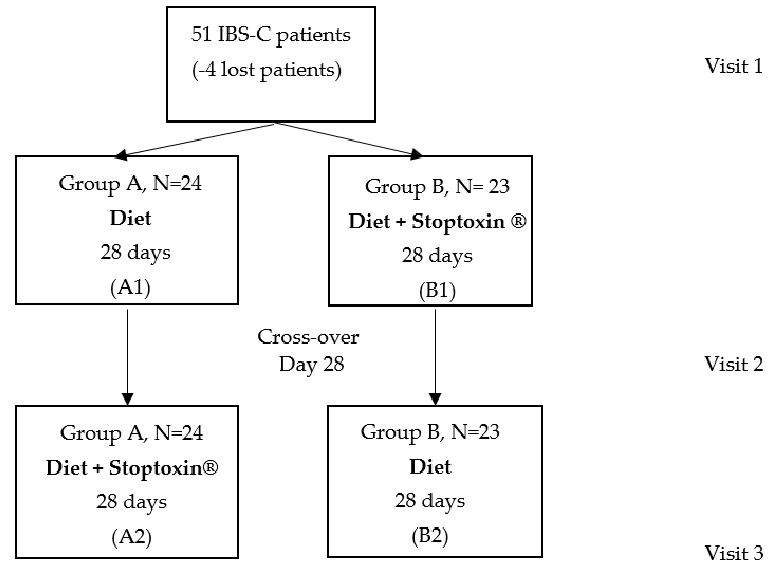
CONSORT flow diagram detailing patient enrollment, randomization, allocation to treatment and control groups, and final analysis in the IBS-C kombucha intervention trial. Dropout rates and reasons for exclusion are documented at each stage.
Evaluation of the Efficacy of Kombucha-Based Drink Enriched with Inulin and Vitamins …
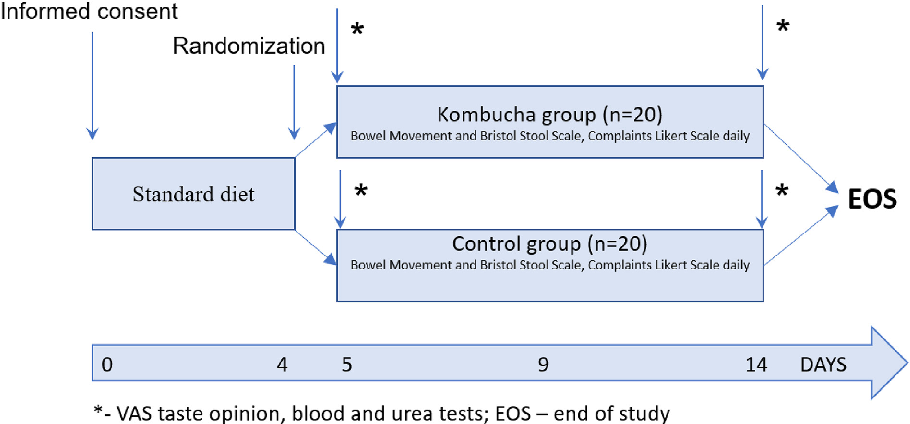
Study design schematic illustrating the intervention protocol, including kombucha drink composition (with inulin and vitamin supplementation), dosing schedule, and assessment timepoints across the trial period.
Evaluation of the Efficacy of Kombucha-Based Drink Enriched with Inulin and Vitamins …
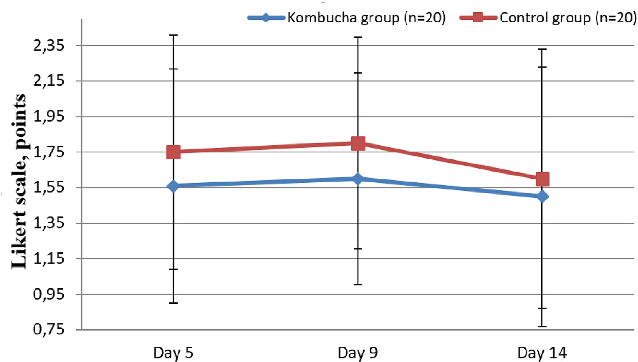
Comparison of bloating severity scores between the kombucha intervention group and control group over the study period. Reductions in bloating severity suggest the enriched kombucha drink may be associated with symptomatic improvement in IBS-C patients.
Evaluation of the Efficacy of Kombucha-Based Drink Enriched with Inulin and Vitamins …
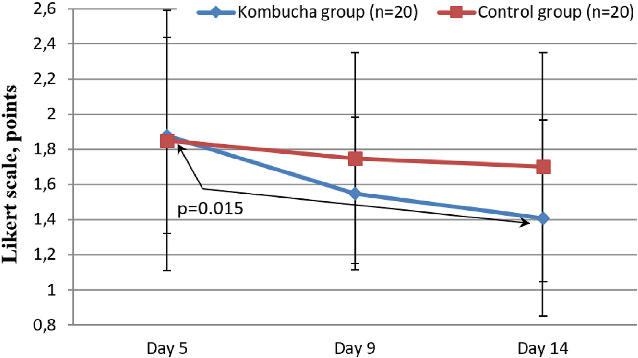
Assessment of the feeling of incomplete bowel emptying in IBS-C patients receiving the kombucha-based drink versus controls. Severity scores at multiple timepoints indicate a trend toward improvement in the intervention group.
Evaluation of the Efficacy of Kombucha-Based Drink Enriched with Inulin and Vitamins …
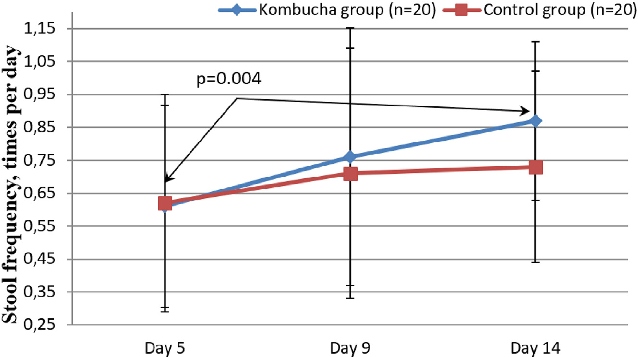
Stool frequency data comparing the kombucha intervention and control groups across the study timeline. Increased bowel movement frequency in the treatment group suggests a potential benefit of the inulin- and vitamin-enriched kombucha formulation.
Evaluation of the Efficacy of Kombucha-Based Drink Enriched with Inulin and Vitamins …
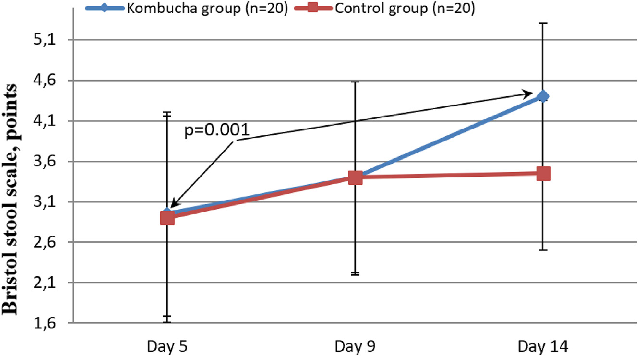
Stool consistency scores evaluated using the Bristol Stool Scale for both study groups. Improvements in stool consistency over the intervention period suggest the kombucha-based drink may help normalize bowel habits in IBS-C patients.
Evaluation of the Efficacy of Kombucha-Based Drink Enriched with Inulin and Vitamins …
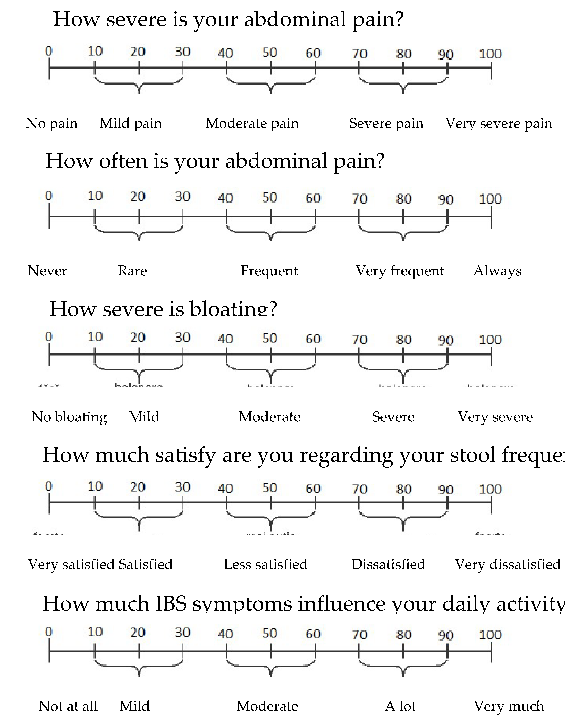
Comparative analysis of individual IBS symptom domains across treatment groups, evaluating the differential effects of the inulin-choline-silymarin supplement.
Inulin, Choline and Silymarin in the Treatment of Irritable Bowel Syndrome with …
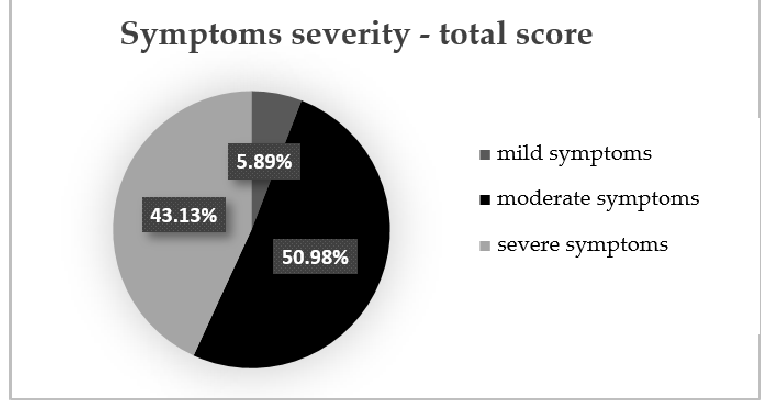
Symptom severity distribution at the initial evaluation, revealing that approximately half of the IBS-C patients presented with moderate symptoms while over 40% had severe manifestations.
Inulin, Choline and Silymarin in the Treatment of Irritable Bowel Syndrome with …
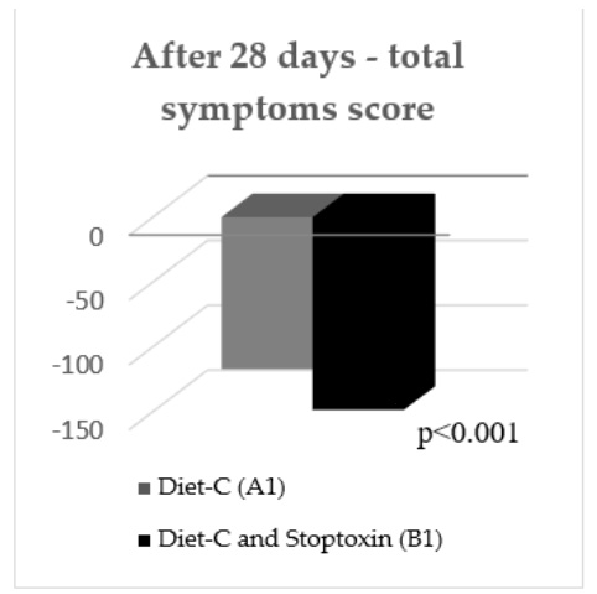
Total IBS symptom scores measured at the 28-day assessment point, comparing outcomes between the supplemented and control diet groups in the crossover design.
Inulin, Choline and Silymarin in the Treatment of Irritable Bowel Syndrome with …
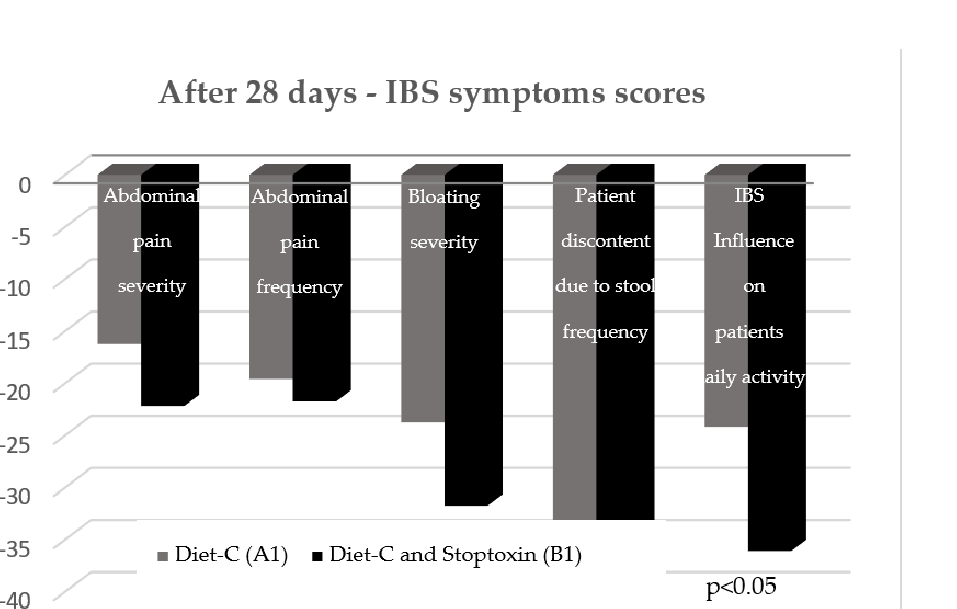
Analysis of gastrointestinal symptom domains in the IBS-C study at an intermediate time point, tracking changes in bloating, pain, and bowel habit parameters.
Inulin, Choline and Silymarin in the Treatment of Irritable Bowel Syndrome with …
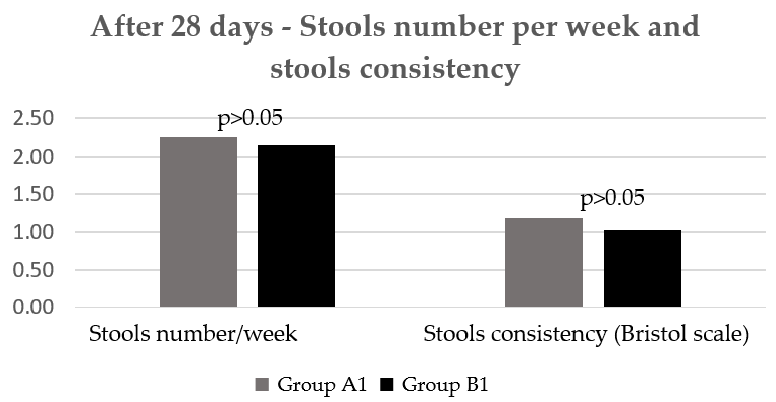
Stool frequency and consistency measurements during the treatment phase, evaluating whether inulin-based supplementation improved bowel regularity in IBS-C patients.
Inulin, Choline and Silymarin in the Treatment of Irritable Bowel Syndrome with …
Quality of life assessment data from IBS-C patients, comparing self-reported well-being between supplementation and control periods.
Inulin, Choline and Silymarin in the Treatment of Irritable Bowel Syndrome with …
Individual patient response trajectories over the treatment period, illustrating the variability in symptom improvement with the prebiotic supplement.
Inulin, Choline and Silymarin in the Treatment of Irritable Bowel Syndrome with …
Subgroup analysis of treatment response stratified by baseline symptom severity, exploring whether patients with severe IBS-C derived greater benefit from supplementation.
Inulin, Choline and Silymarin in the Treatment of Irritable Bowel Syndrome with …
Secondary endpoint analysis from the IBS-C trial, including measures of abdominal discomfort and transit time.
Inulin, Choline and Silymarin in the Treatment of Irritable Bowel Syndrome with …
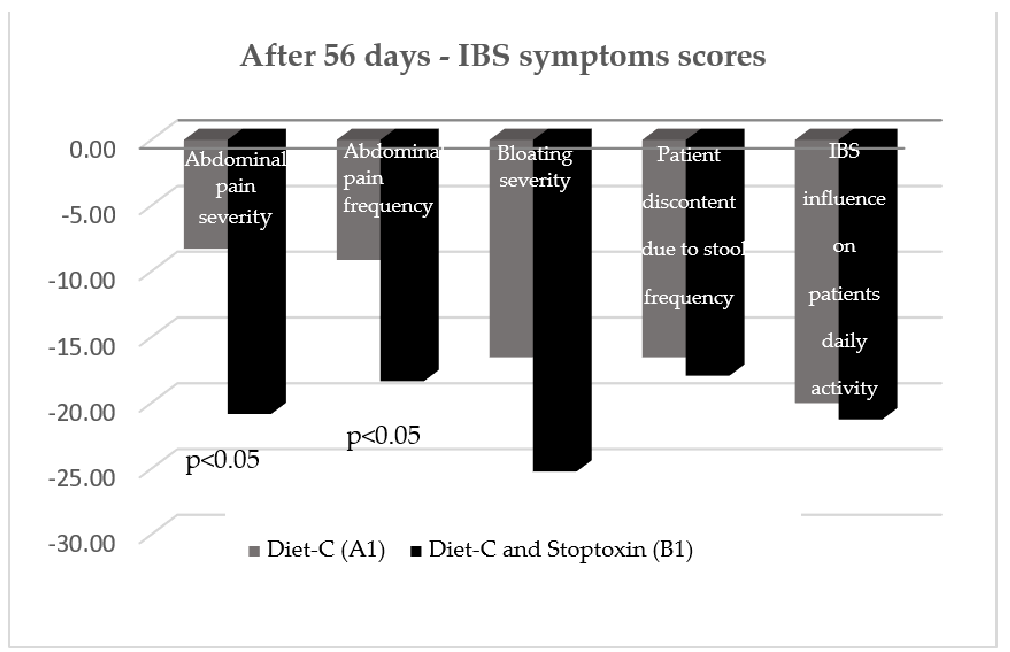
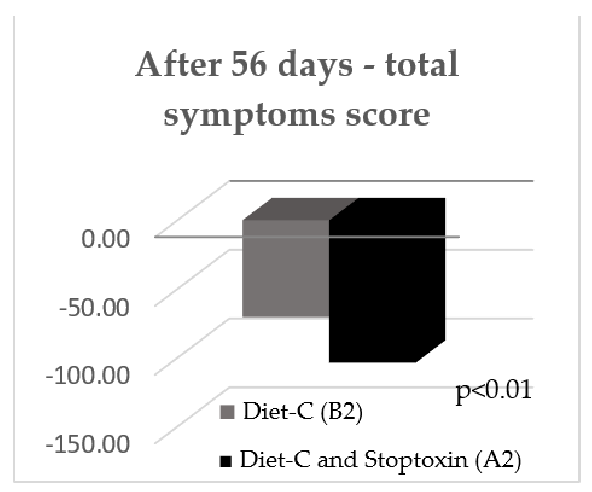
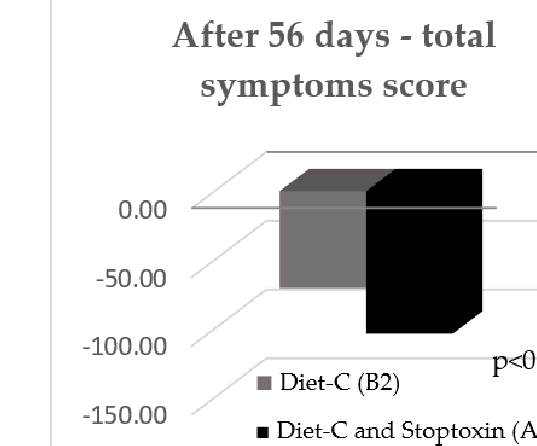
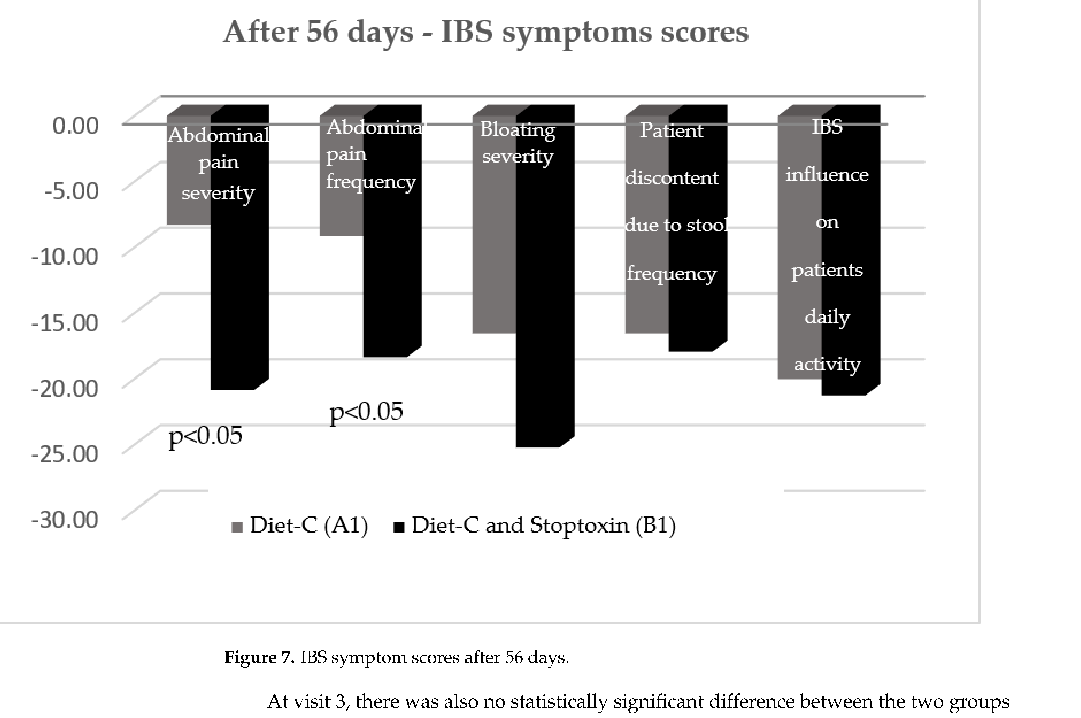
IBS symptom scores after 56 days of treatment, providing longer-term efficacy data for the inulin, choline, and silymarin supplementation regimen.
Inulin, Choline and Silymarin in the Treatment of Irritable Bowel Syndrome with …
Crossover period analysis comparing symptom trajectories when patients switched between the supplemented and unsupplemented diet phases.
Inulin, Choline and Silymarin in the Treatment of Irritable Bowel Syndrome with …
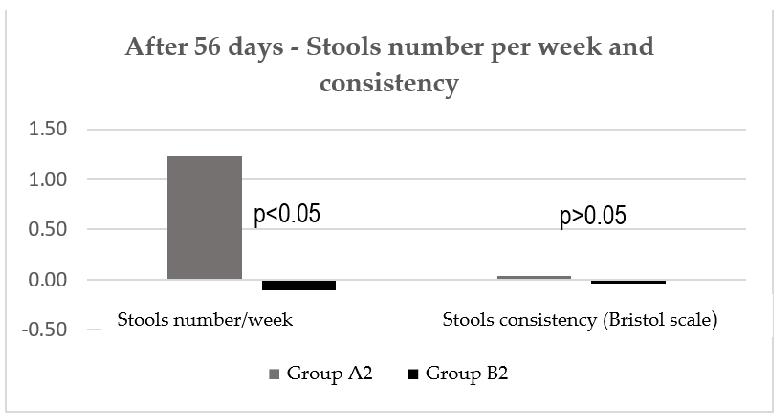
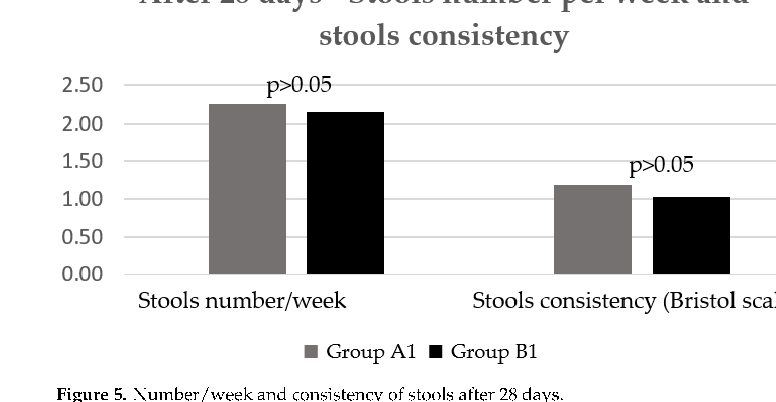
Stool frequency per week and stool consistency measurements after 56 days, indicating sustained effects of the prebiotic supplement on bowel function.
Inulin, Choline and Silymarin in the Treatment of Irritable Bowel Syndrome with …
Summary of adverse events or tolerability data from the IBS-C supplementation trial, documenting the safety profile of the inulin-choline-silymarin combination.
Inulin, Choline and Silymarin in the Treatment of Irritable Bowel Syndrome with …
From Structure to Function: How Prebiotic Diversity Shapes Gut Integrity and Immune …
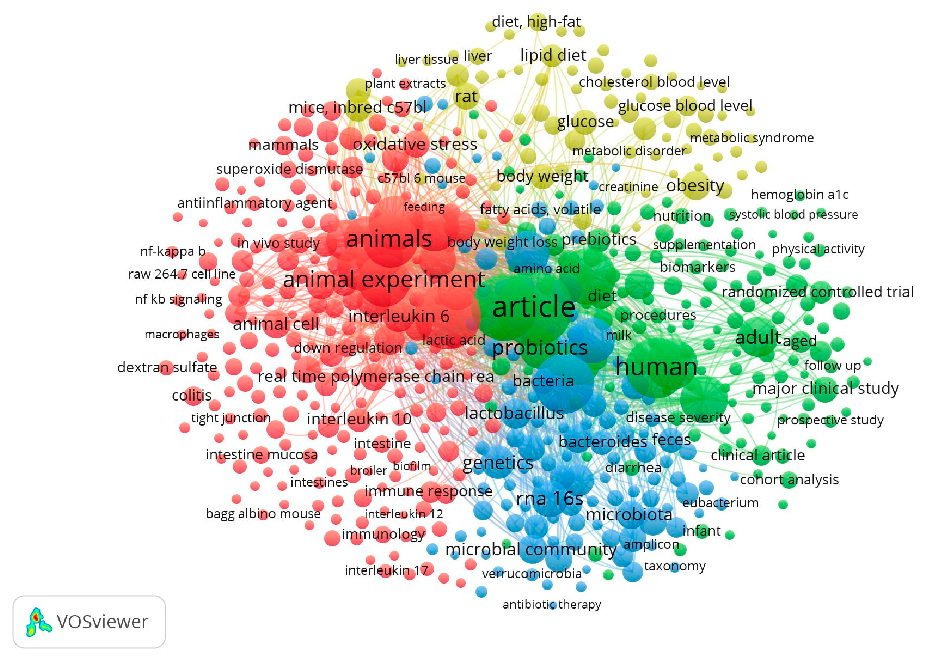
From Structure to Function: How Prebiotic Diversity Shapes Gut Integrity and Immune …
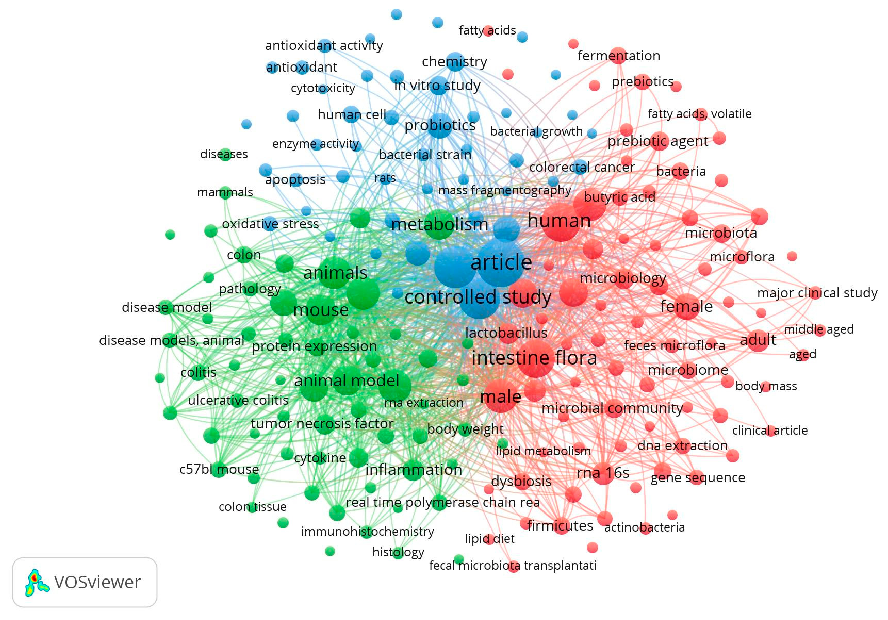
From Structure to Function: How Prebiotic Diversity Shapes Gut Integrity and Immune …
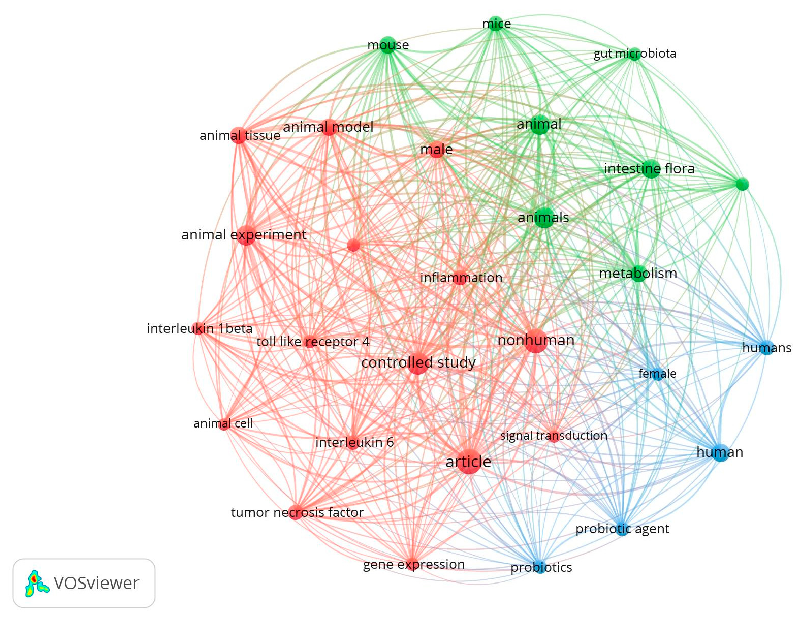
From Structure to Function: How Prebiotic Diversity Shapes Gut Integrity and Immune …
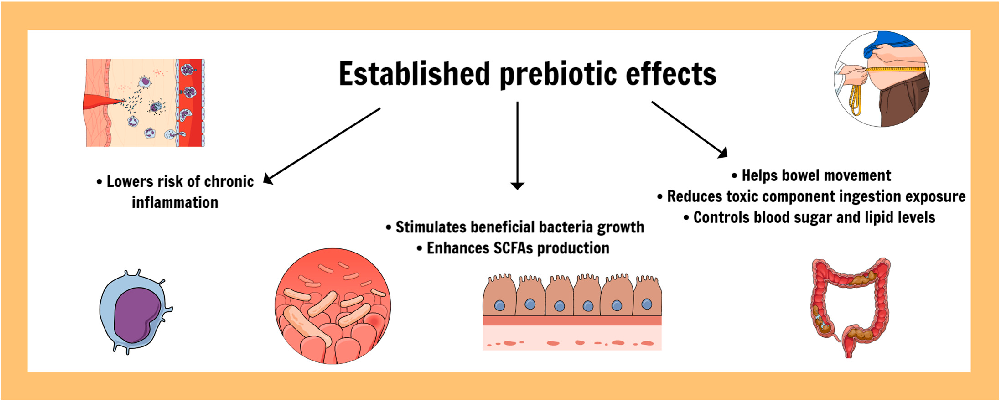
Figure 5. Established prebiotic effects for intestinal and systemic health.
From Structure to Function: How Prebiotic Diversity Shapes Gut Integrity and Immune …
Page 2 of 3