Lactase Hình ảnh
20 hình ảnh từ nghiên cứu có bình duyệt
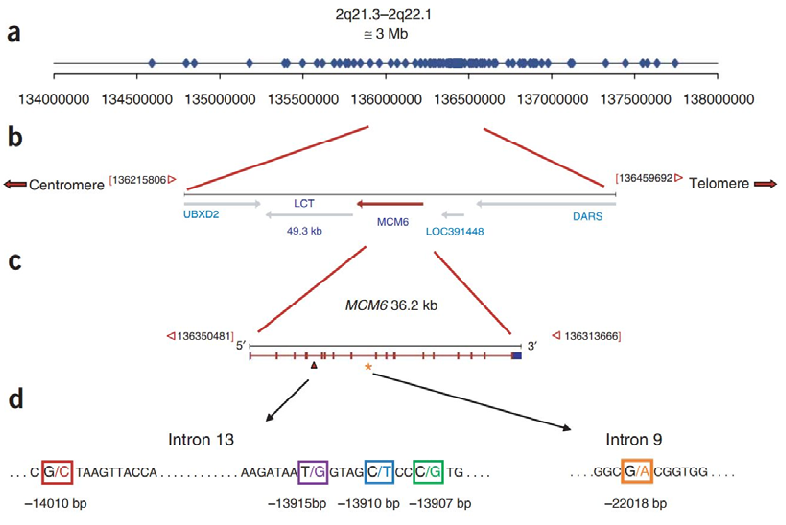
Genetic map of the lactase (LCT) and MCM6 gene region displays the locations of key single nucleotide polymorphisms associated with lactase persistence and non-persistence phenotypes across populations.
Lactose Intolerance in Adults: Biological Mechanism and Dietary Management.
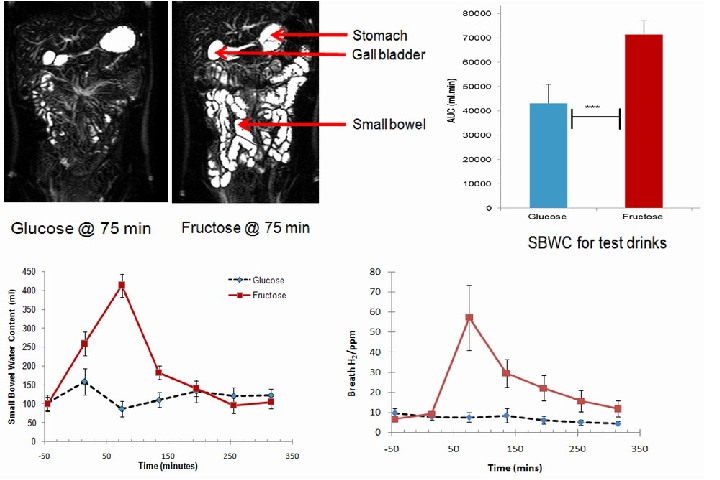
Small bowel water content and breath hydrogen concentrations after consuming glucose and fructose drinks are plotted over time, providing reference data for comparison with lactose challenge tests.
Lactose Intolerance in Adults: Biological Mechanism and Dietary Management.
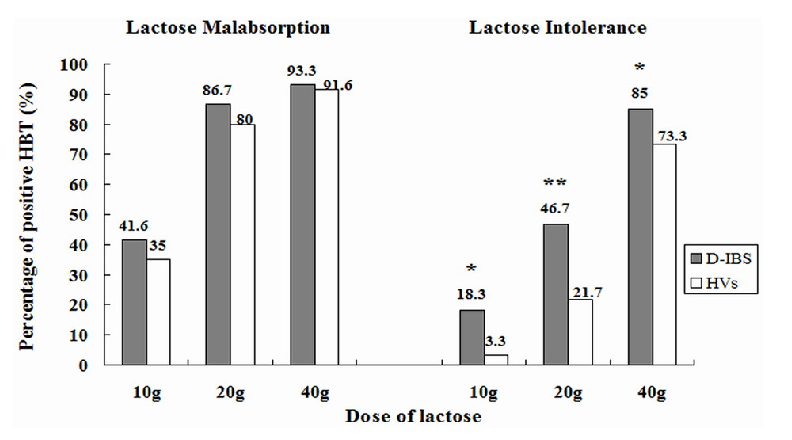
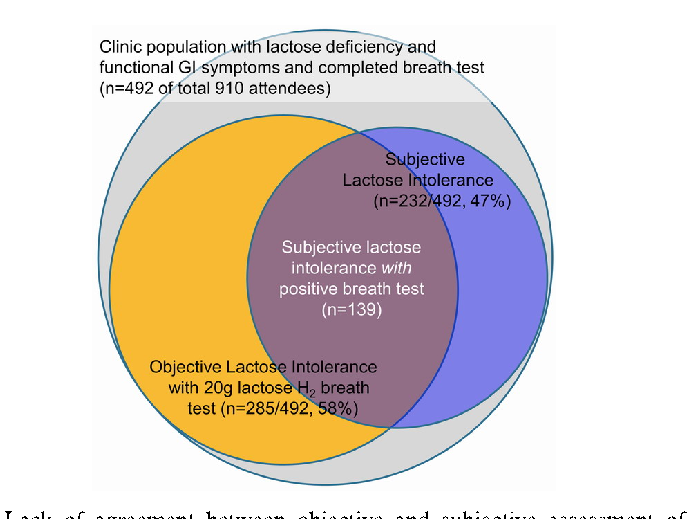
Prevalence of lactose malabsorption versus symptomatic lactose intolerance in IBS-D patients is compared, demonstrating that malabsorption does not invariably produce clinical symptoms.
Lactose Intolerance in Adults: Biological Mechanism and Dietary Management.
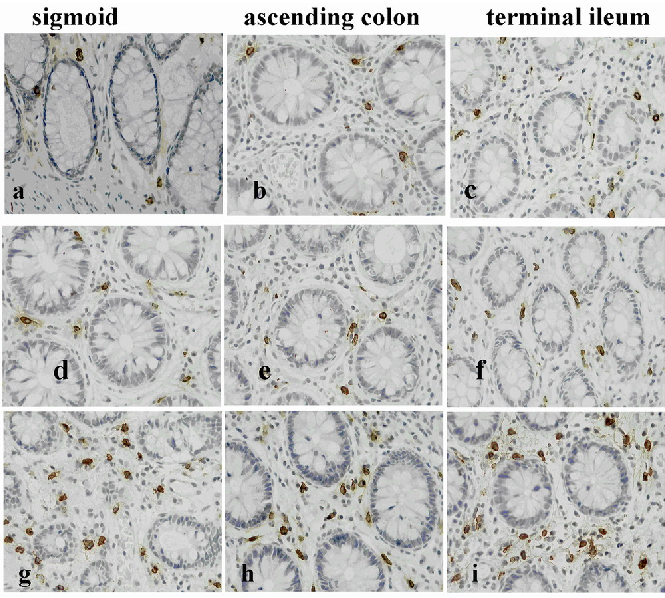
Representative photomicrographs of tryptase-positive mast cells in colonic mucosa compare healthy controls with IBS-D patients, suggesting mast cell involvement in lactose intolerance symptomatology.
Lactose Intolerance in Adults: Biological Mechanism and Dietary Management.
Dietary management strategies for lactose intolerance are summarized, including enzyme supplementation, dairy product selection, and gradual tolerance-building approaches.
Lactose Intolerance in Adults: Biological Mechanism and Dietary Management.
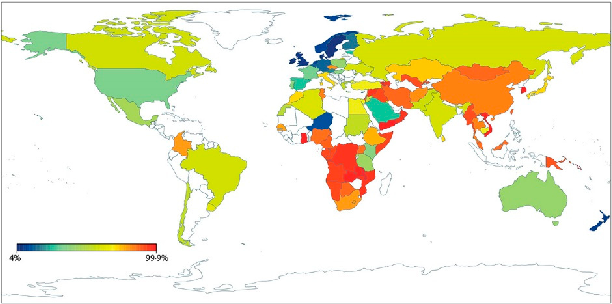
Geographic distribution of lactase non-persistence frequencies reveals wide variation across world populations, with highest persistence rates in Northern European and certain African and Middle Eastern pastoralist populations. East Asian and Native American populations show near-universal non-persistence.
Lactose Intolerance, Dairy Avoidance, and Treatment Options.
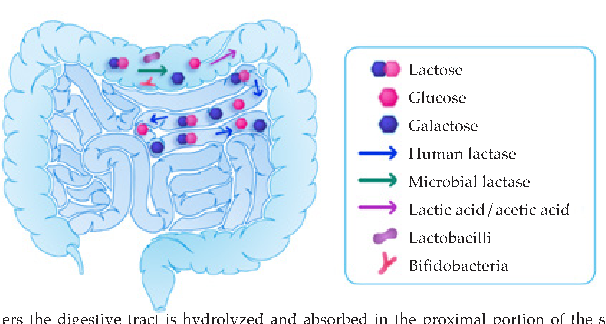
![Figure 1. In the presence of an adequate amount of lactase, lactose is hydrolysed into galactose (Gal) and glucose (Glu), which are rapidly absorbed into the bloodstream, together with H2O molecules (modified from [5]).](https://pdfs.citedhealth.com/figures/30388735/64.png)
Schematic showing the enzymatic hydrolysis of lactose by lactase into galactose and glucose, which are then absorbed into the bloodstream. In lactase-sufficient individuals, this process occurs efficiently in the small intestinal brush border.
Lactose Maldigestion, Malabsorption, and Intolerance: A Comprehensive Review with a Focus on …
![Figure 2. Some of the most important single nucleotide polymorphisms in the lactase gene (modified from [13]).](https://pdfs.citedhealth.com/figures/30388735/100.png)
Map of key single nucleotide polymorphisms (SNPs) in the lactase gene that regulate lactase persistence into adulthood. These genetic variants explain much of the population-level variation in the ability to digest lactose.
Lactose Maldigestion, Malabsorption, and Intolerance: A Comprehensive Review with a Focus on …
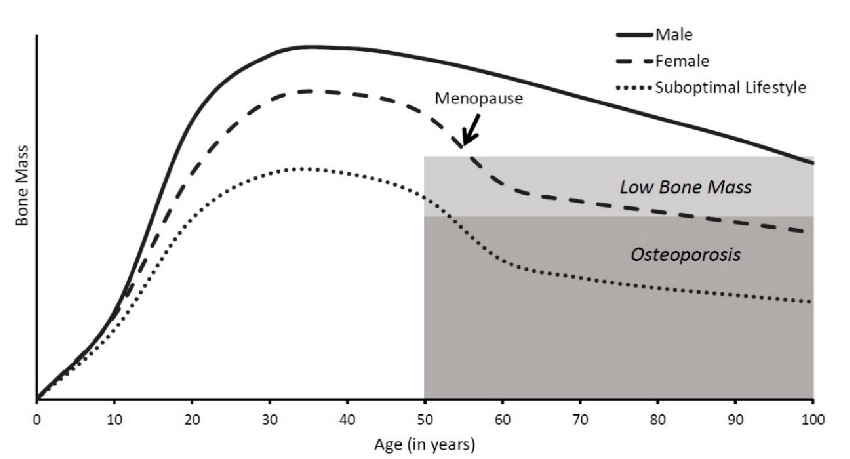
Bone mass changes throughout the human lifespan are charted, showing rapid accumulation during childhood, peak bone mass around age 30, and subsequent gradual decline. Females typically experience accelerated bone loss after menopause, underscoring the importance of adequate calcium intake in earlier decades.
Lactose Intolerance and Bone Health: The Challenge of Ensuring Adequate Calcium Intake.
Alpha diversity indices of fecal microbiota are plotted for treated versus placebo groups, indicating whether probiotic supplementation altered overall bacterial community richness.
Effects of Bifidobacterium longum and Lactobacillus rhamnosus on Gut Microbiota in Patients …
Lactose tolerance test outcomes are compared between intervention groups, with symptom severity mapped against breath hydrogen concentrations.
Effects of Bifidobacterium longum and Lactobacillus rhamnosus on Gut Microbiota in Patients …
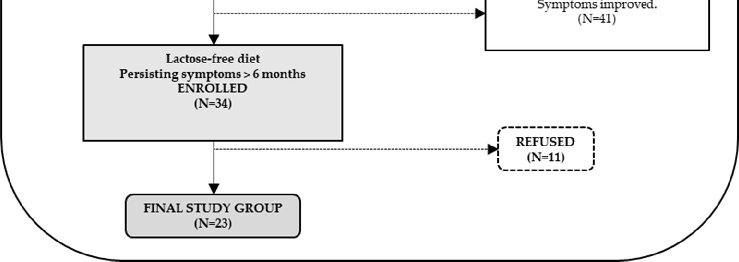
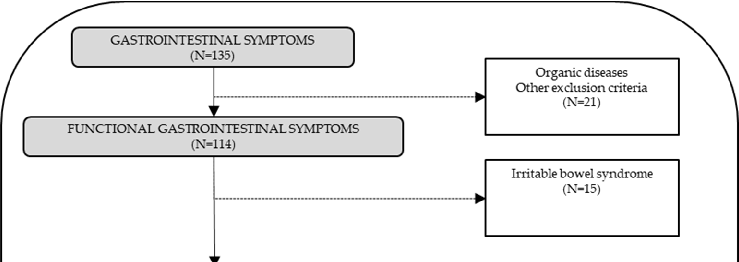
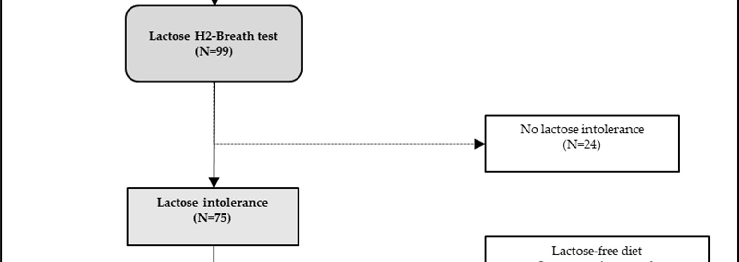
A CONSORT flow chart traces patient screening and enrollment for this trial of Bifidobacterium longum and Lactobacillus rhamnosus in lactose-intolerant individuals, detailing exclusions for organic diseases and final group assignments.
Effects of Bifidobacterium longum and Lactobacillus rhamnosus on Gut Microbiota in Patients …
Fecal short-chain fatty acid concentrations are measured across treatment groups, reflecting metabolic activity changes in the gut microbiome following probiotic administration.
Effects of Bifidobacterium longum and Lactobacillus rhamnosus on Gut Microbiota in Patients …
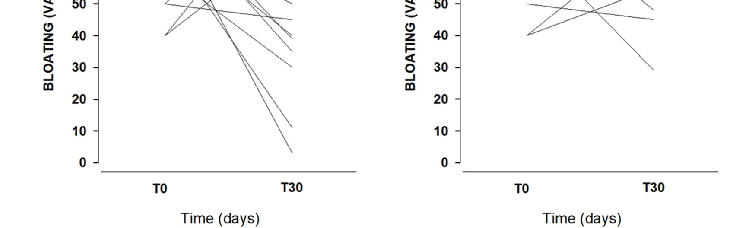
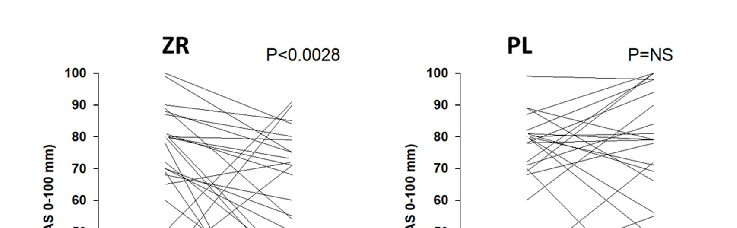
Individual patient trajectories for bloating severity, measured on a 0-100 mm visual analogue scale, are plotted at baseline and after 30 days for both the probiotic treatment and placebo groups.
Effects of Bifidobacterium longum and Lactobacillus rhamnosus on Gut Microbiota in Patients …
Symptom improvement scores for lactose-intolerant patients receiving a combined Bifidobacterium longum and Lactobacillus rhamnosus preparation are compared with placebo responses over the treatment period.
Effects of Bifidobacterium longum and Lactobacillus rhamnosus on Gut Microbiota in Patients …

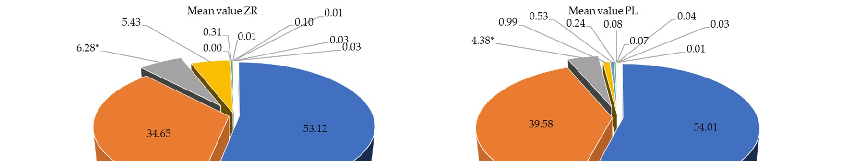
Relative proportions of bacterial phyla in fecal samples are compared between probiotic-treated and placebo groups, revealing shifts in gut microbiota composition following Bifidobacterium longum and Lactobacillus rhamnosus supplementation.
Effects of Bifidobacterium longum and Lactobacillus rhamnosus on Gut Microbiota in Patients …
Hydrogen breath test results before and after probiotic supplementation are presented, indicating alterations in lactose fermentation patterns associated with treatment.
Effects of Bifidobacterium longum and Lactobacillus rhamnosus on Gut Microbiota in Patients …
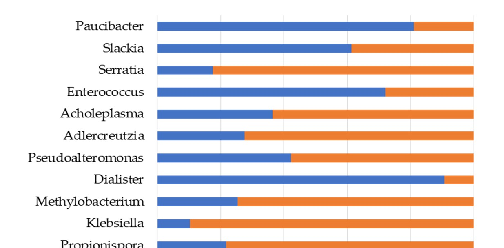
Bacterial genera showing statistically significant differences between probiotic-treated and placebo patients are depicted, highlighting specific microbial populations responsive to Bifidobacterium and Lactobacillus supplementation.
Effects of Bifidobacterium longum and Lactobacillus rhamnosus on Gut Microbiota in Patients …
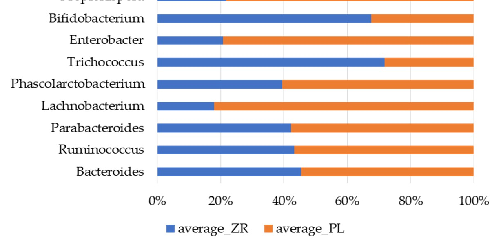
Pathophysiology of lactose intolerance illustrating how undigested lactose causes symptoms through osmotic effects in the intestinal lumen and bacterial fermentation producing hydrogen, carbon dioxide, and methane gases.
Lactose intolerance: myths and facts. An update.
Diagnostic algorithm or classification scheme for lactose intolerance, distinguishing between primary (genetic), secondary (disease-related), and congenital forms of lactase deficiency.
Lactose intolerance: myths and facts. An update.