Butyrate (Sodium/Calcium Butyrate) Şekiller
89 hakemli araştırmalardan görseller
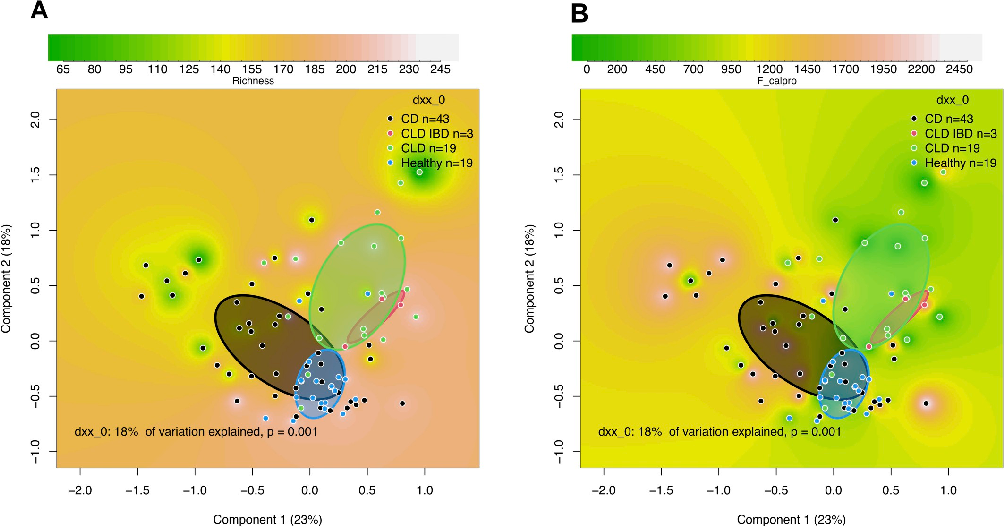
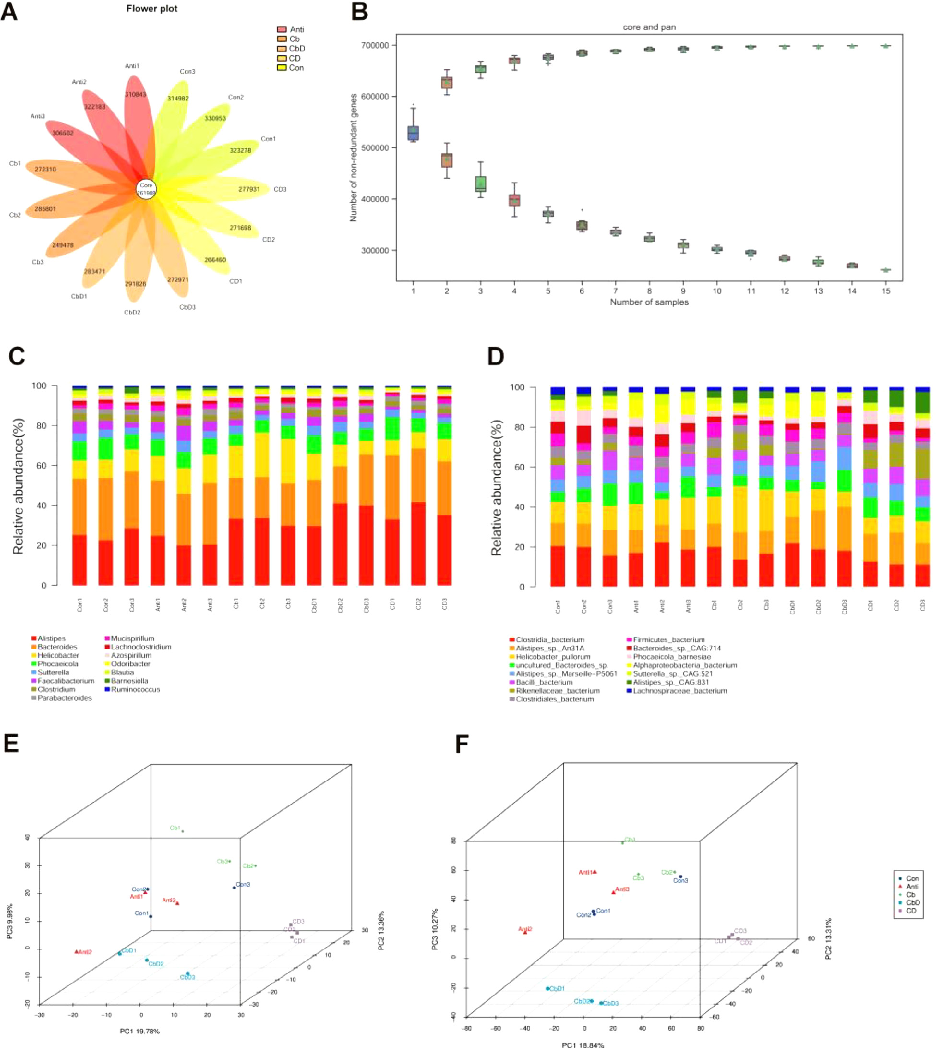
Fig 2. Comparison of fecal microbiota in congenital chloride diarrhea (CLD), CLD-associated inflammatory bowel disease (CLD IBD), Crohn’s disease (CD), and healthy controls. Shown are Principal-coordinate Analysis (PcoA) plots based …
Fecal microbiota in congenital chloride diarrhea and inflammatory bowel disease.
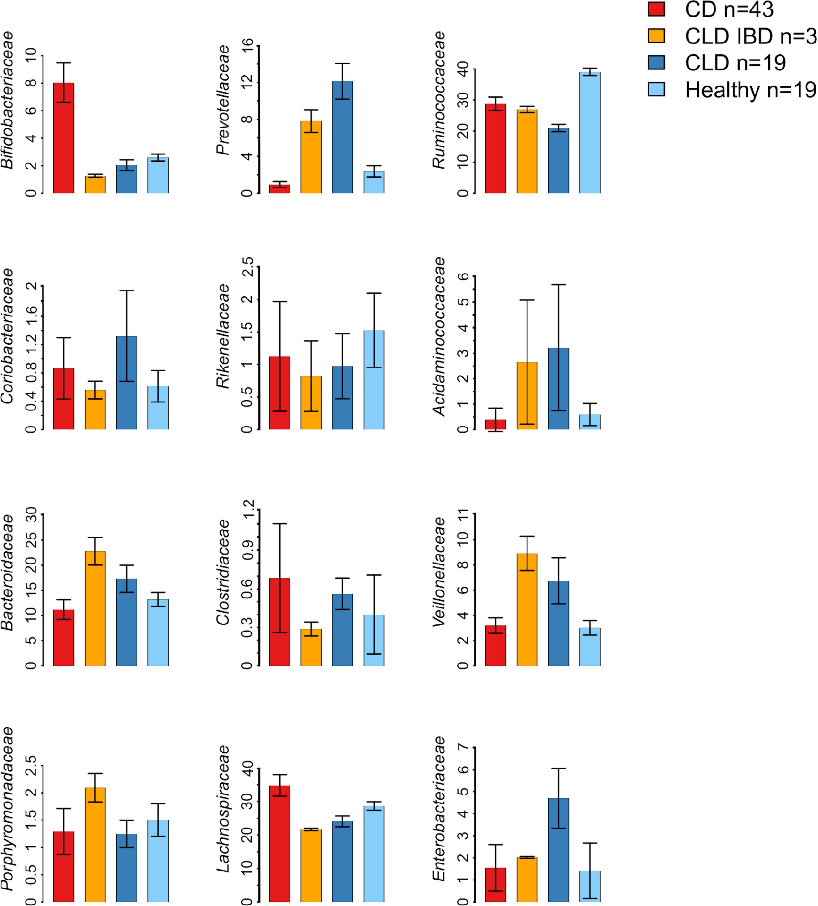
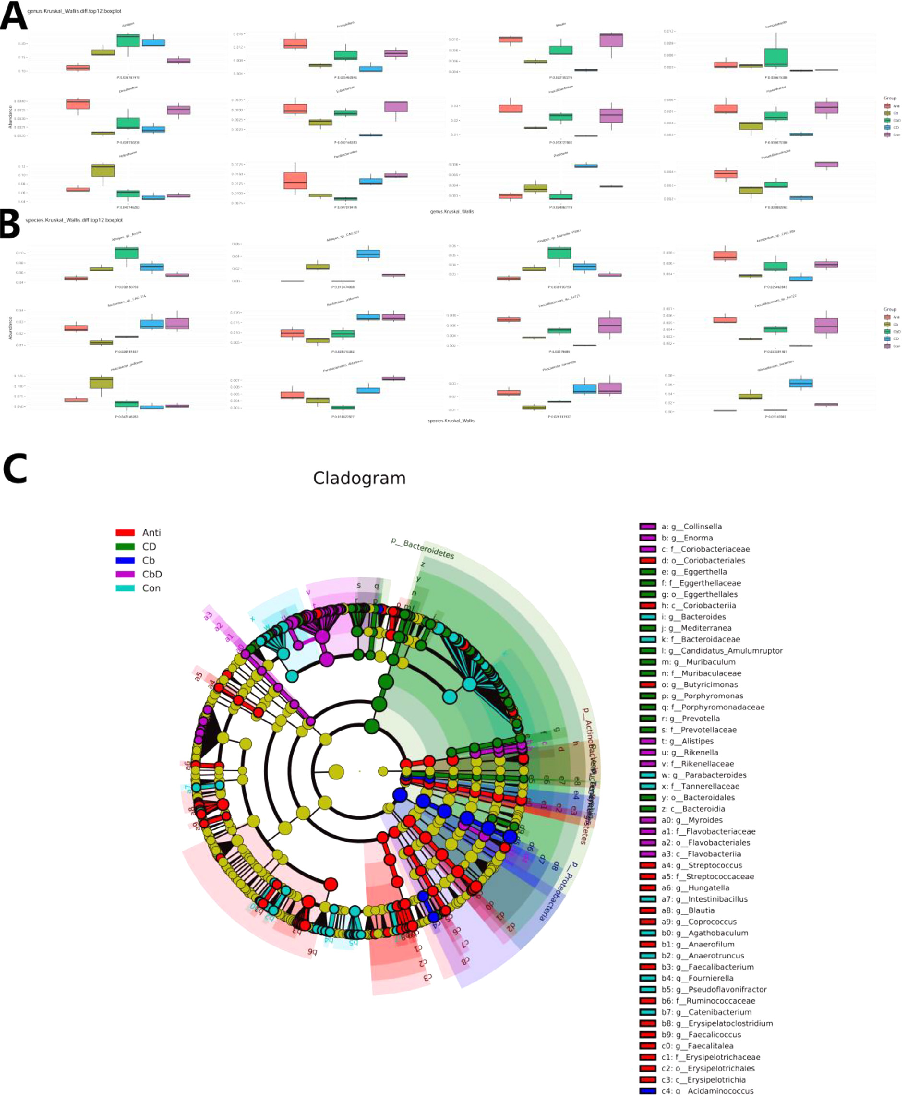
Fig 3. Microbiota composition in congenital chloride diarrhea (CLD), CLD-associated IBD (CLD IBD), Crohn’s disease (CD), and healthy controls. Shown are family-level microbiota composition for the taxa with significant differences …
Fecal microbiota in congenital chloride diarrhea and inflammatory bowel disease.
Fecal microbiota in congenital chloride diarrhea and inflammatory bowel disease.
Experimental results examining effect of Nuts on Gastrointestinal Health, with data points illustrating key findings related to nuts are high nutrient-dense foods containing healthy lipids, dietary fiber, and bioactive phytochemicals, including .
Effect of Nuts on Gastrointestinal Health.
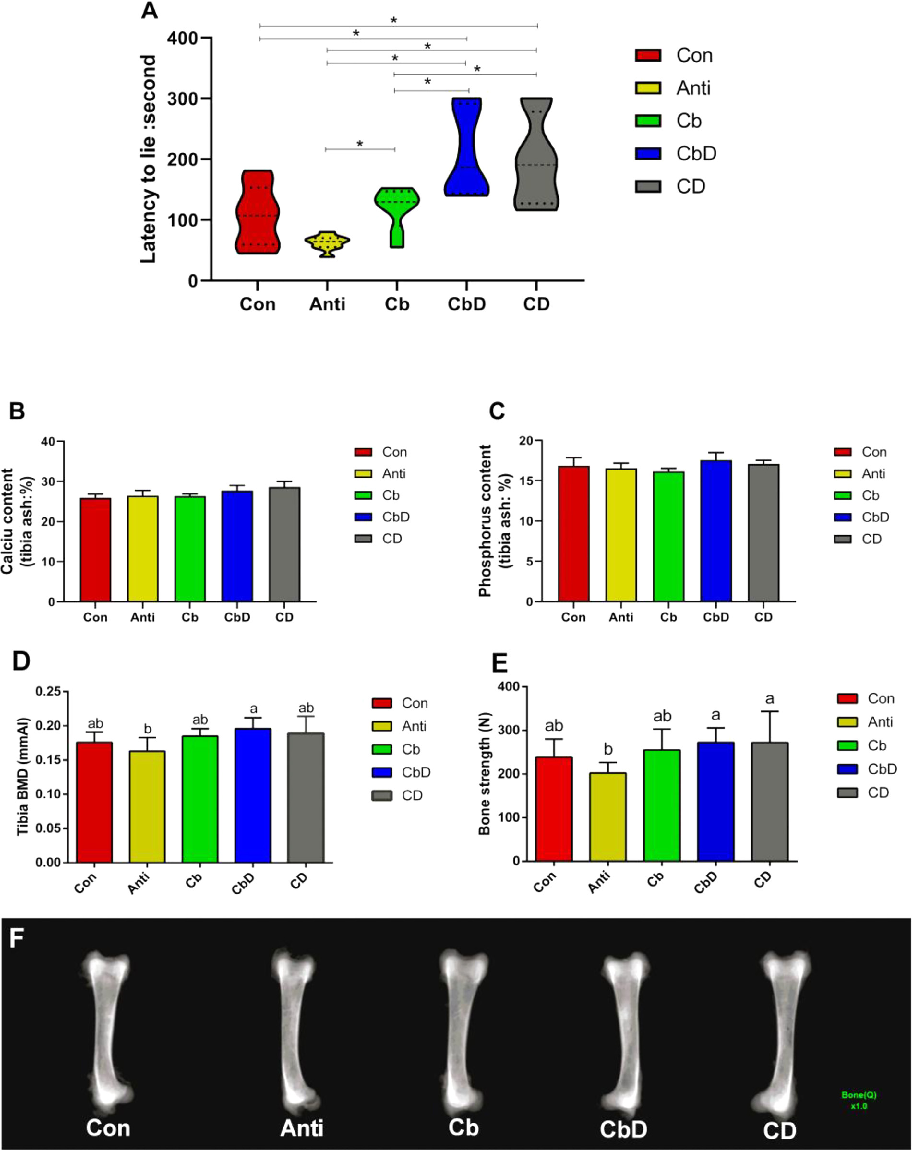
Effects of dietary Clostridium butyricum and 25-hydroxyvitamin D3 supplementation on latency-to-lie time in a poultry model, indicating improvements in leg health and bone strength.
Dietary Clostridium butyricum and 25-Hydroxyvitamin D3 modulate bone metabolism of broilers through …
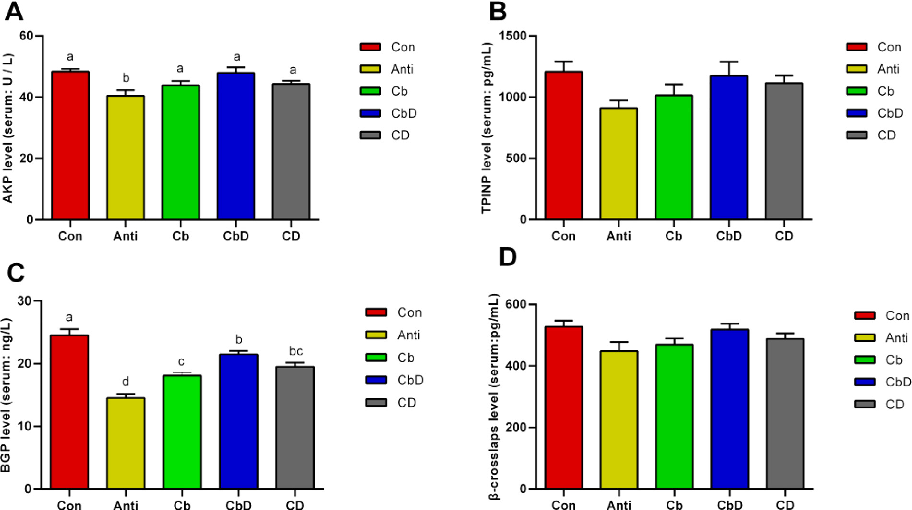
Experimental data from a study on dietary Clostridium butyricum and 25-hydroxyvitamin D3 and their combined effects on bone metabolism through gut microbiota modulation in poultry.
Dietary Clostridium butyricum and 25-Hydroxyvitamin D3 modulate bone metabolism of broilers through …
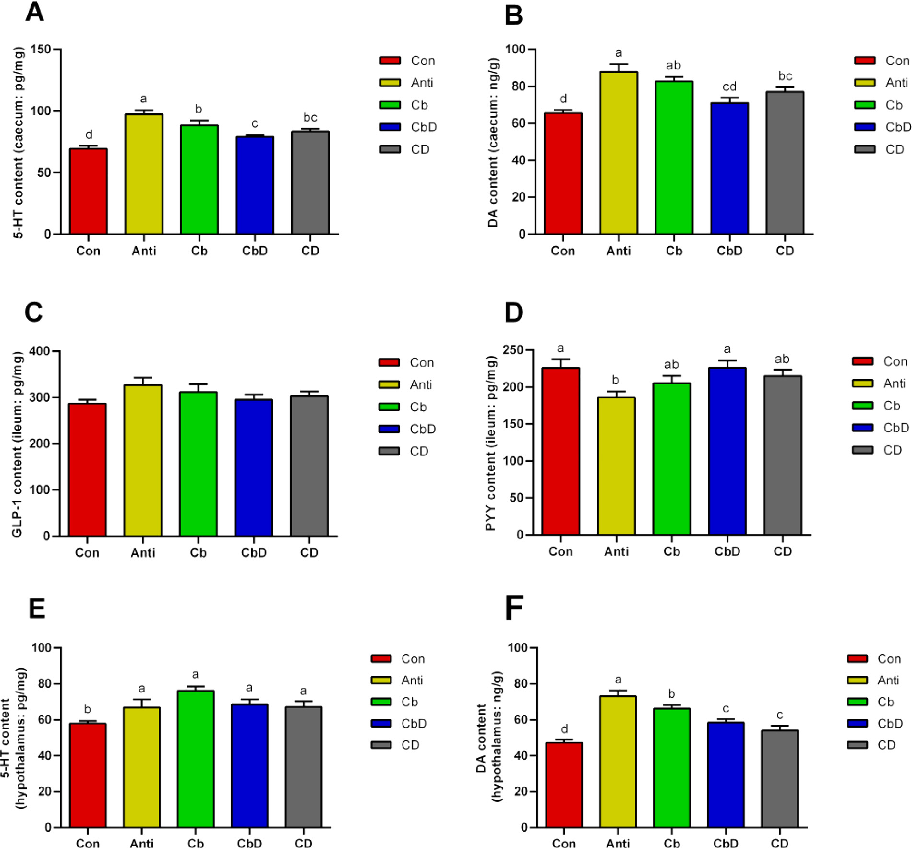
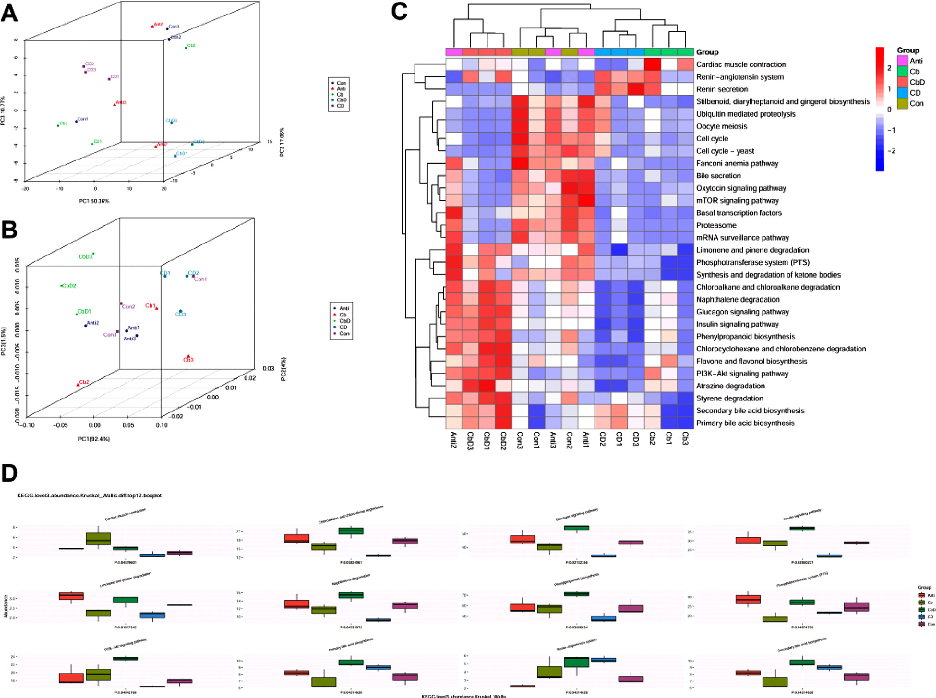
Hypothalamic signaling pathway analysis in poultry fed Clostridium butyricum and 25-hydroxyvitamin D3, examining effects on bone metabolism regulatory mechanisms.
Dietary Clostridium butyricum and 25-Hydroxyvitamin D3 modulate bone metabolism of broilers through …
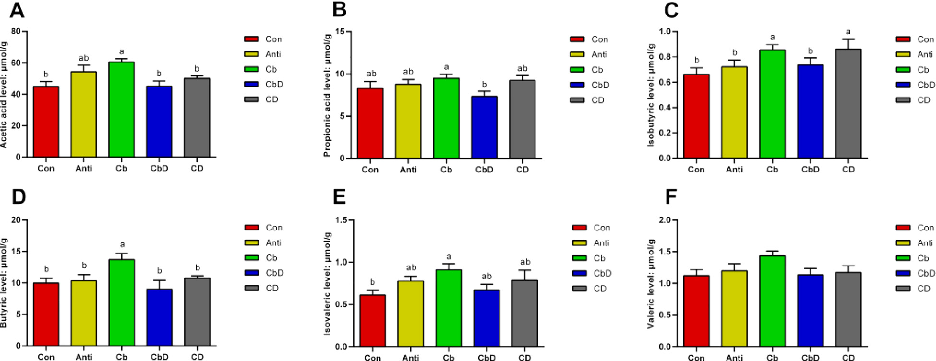
Caecal short-chain fatty acid (SCFA) concentrations in poultry supplemented with Clostridium butyricum and 25-hydroxyvitamin D3, linking gut fermentation products to bone metabolism modulation.
Dietary Clostridium butyricum and 25-Hydroxyvitamin D3 modulate bone metabolism of broilers through …
Metagenomic analysis of caecal microbiota in poultry receiving Clostridium butyricum and 25-hydroxyvitamin D3 supplementation, revealing shifts in microbial community structure.
Dietary Clostridium butyricum and 25-Hydroxyvitamin D3 modulate bone metabolism of broilers through …
Caecal microbial composition data from poultry treated with Clostridium butyricum and 25-hydroxyvitamin D3, showing taxonomic-level changes associated with improved bone metabolism.
Dietary Clostridium butyricum and 25-Hydroxyvitamin D3 modulate bone metabolism of broilers through …
Metagenomic analysis of caecal microbiota in poultry receiving Clostridium butyricum and 25-hydroxyvitamin D3 supplementation, revealing shifts in microbial community structure.
Dietary Clostridium butyricum and 25-Hydroxyvitamin D3 modulate bone metabolism of broilers through …
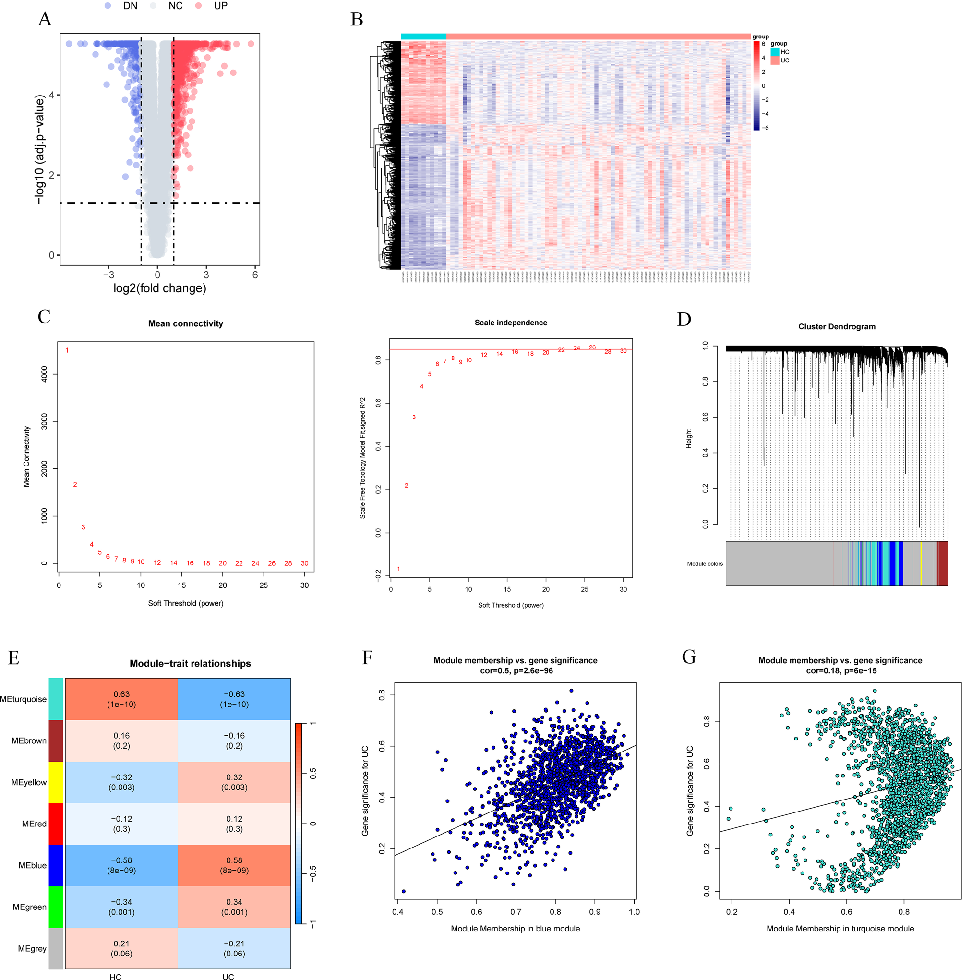
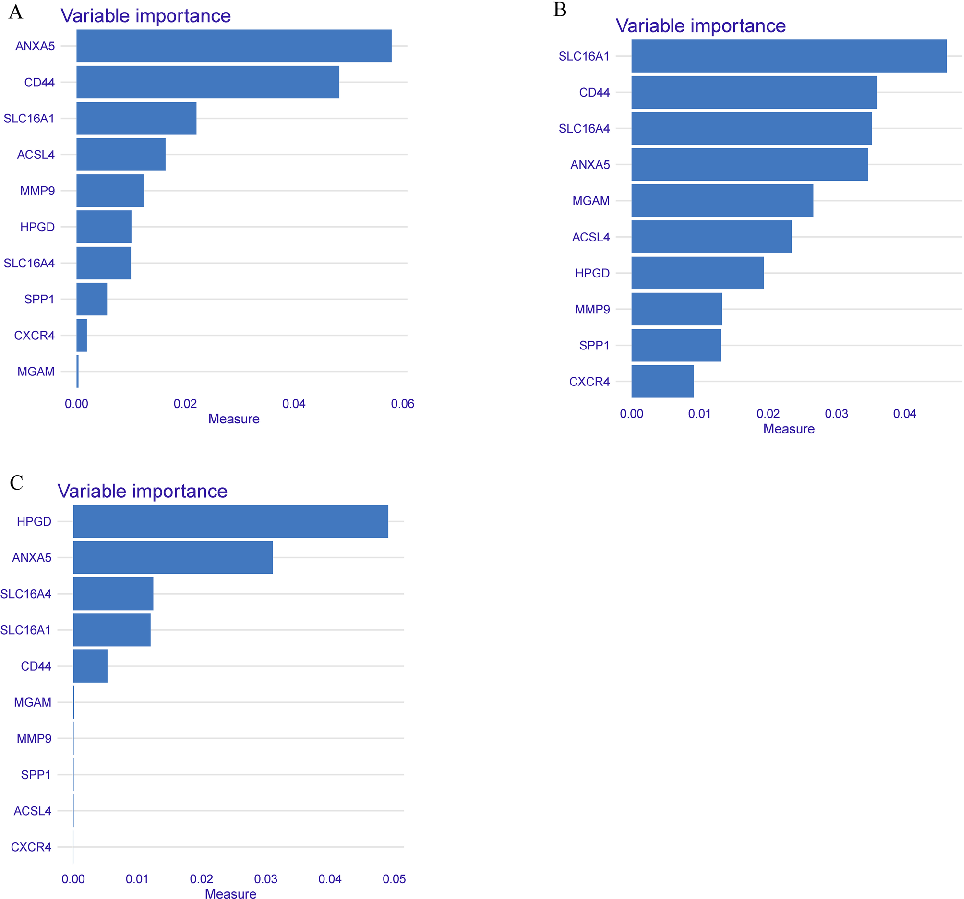
Identification of butyrate metabolism-related genes shared between metabolic-associated steatotic liver disease (MASLD) and colorectal cancer, using bioinformatic screening approaches.
Exploring the butyrate metabolism-related shared genes in metabolic associated steatohepatitis and ulcerative …
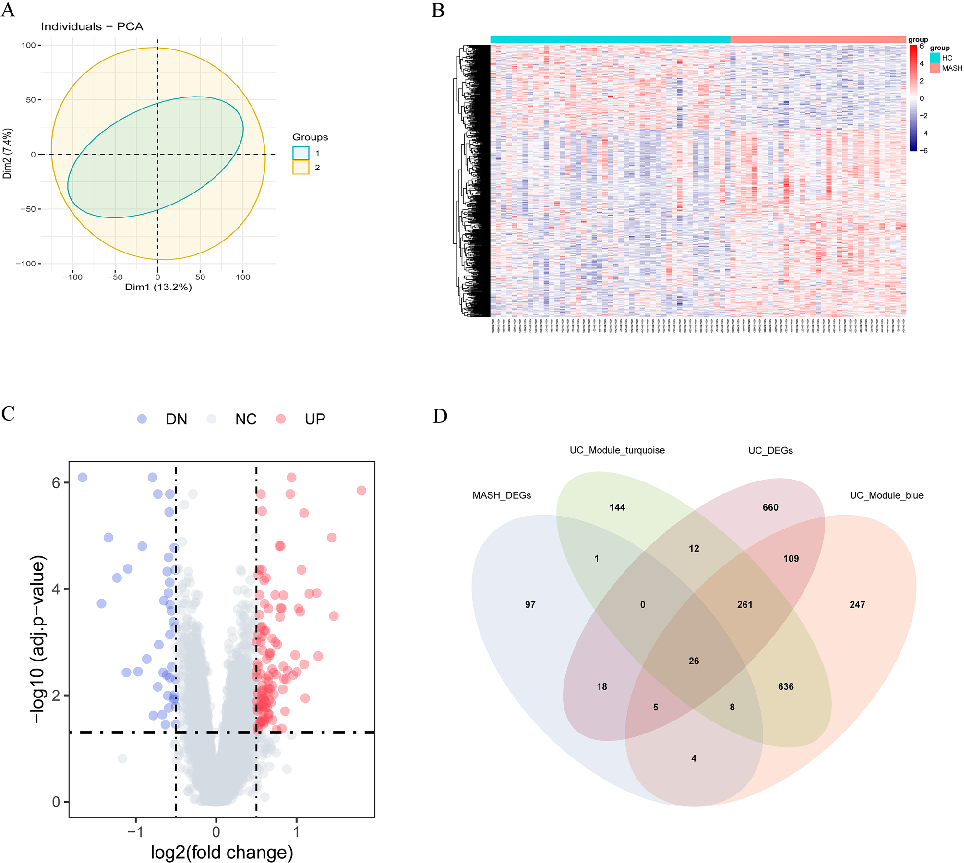
Gene expression analysis of butyrate metabolism-related shared genes across MASLD and colorectal cancer datasets, highlighting differential expression patterns.
Exploring the butyrate metabolism-related shared genes in metabolic associated steatohepatitis and ulcerative …
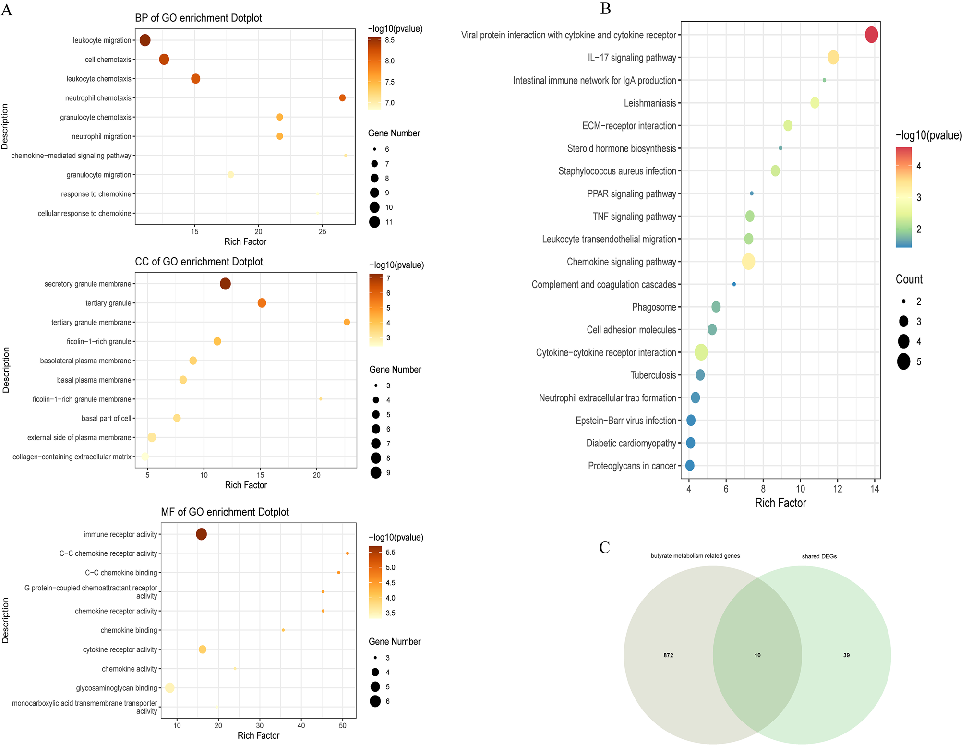
Functional enrichment analysis of the identified butyrate metabolism-related shared genes, mapping their involvement in key metabolic and immune pathways.
Exploring the butyrate metabolism-related shared genes in metabolic associated steatohepatitis and ulcerative …
Protein-protein interaction network of butyrate metabolism-related genes implicated in both MASLD and colorectal cancer pathogenesis.
Exploring the butyrate metabolism-related shared genes in metabolic associated steatohepatitis and ulcerative …
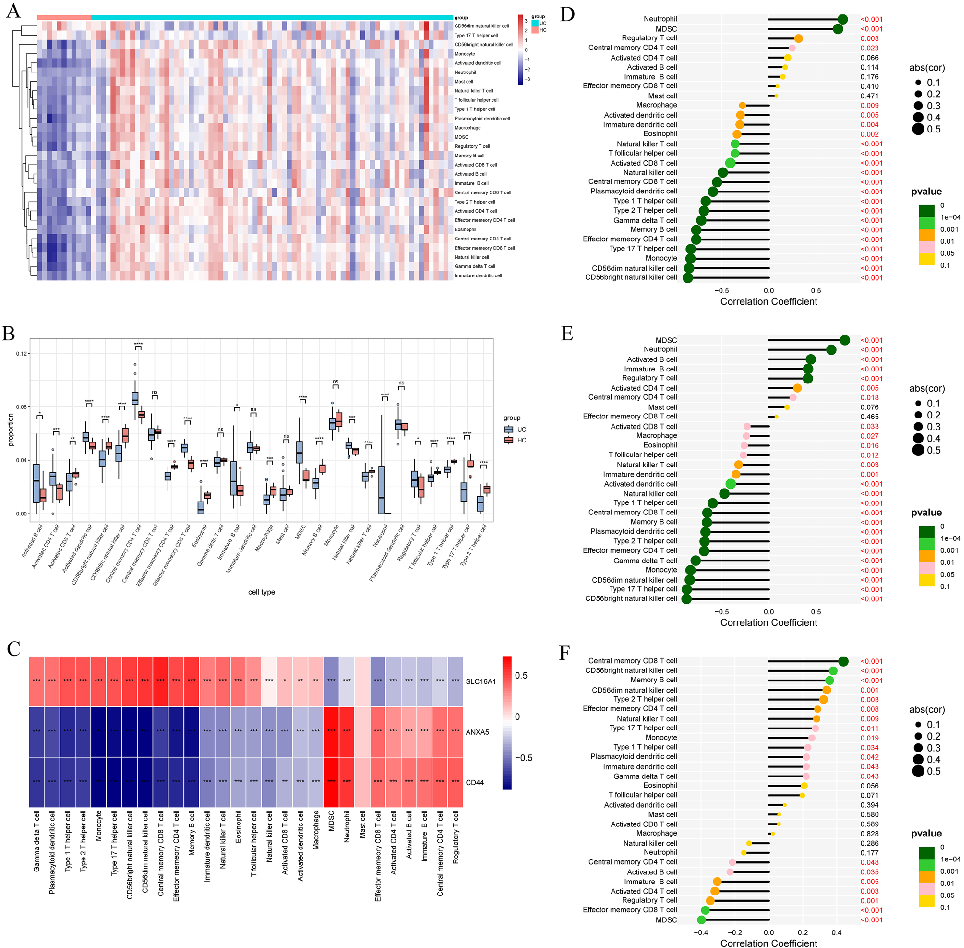
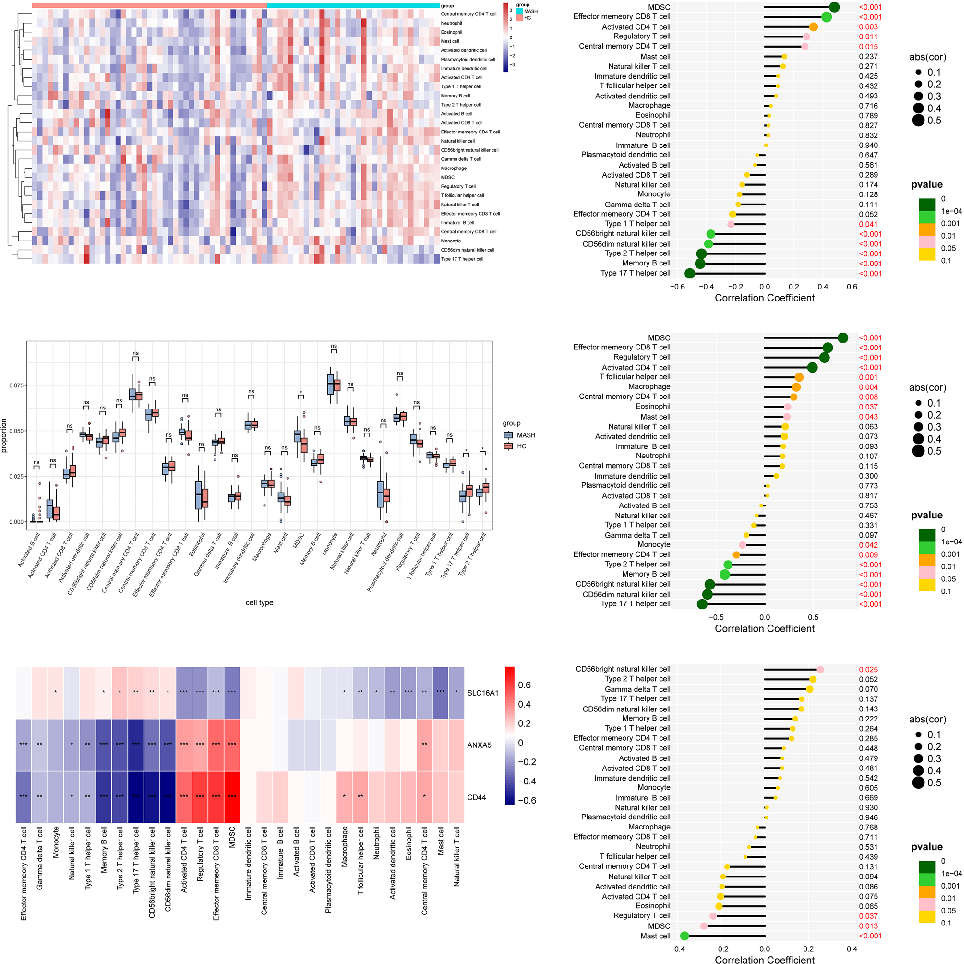
Immune cell infiltration analysis in MASLD and colorectal cancer tissues, correlating butyrate metabolism gene expression with immune microenvironment composition.
Exploring the butyrate metabolism-related shared genes in metabolic associated steatohepatitis and ulcerative …
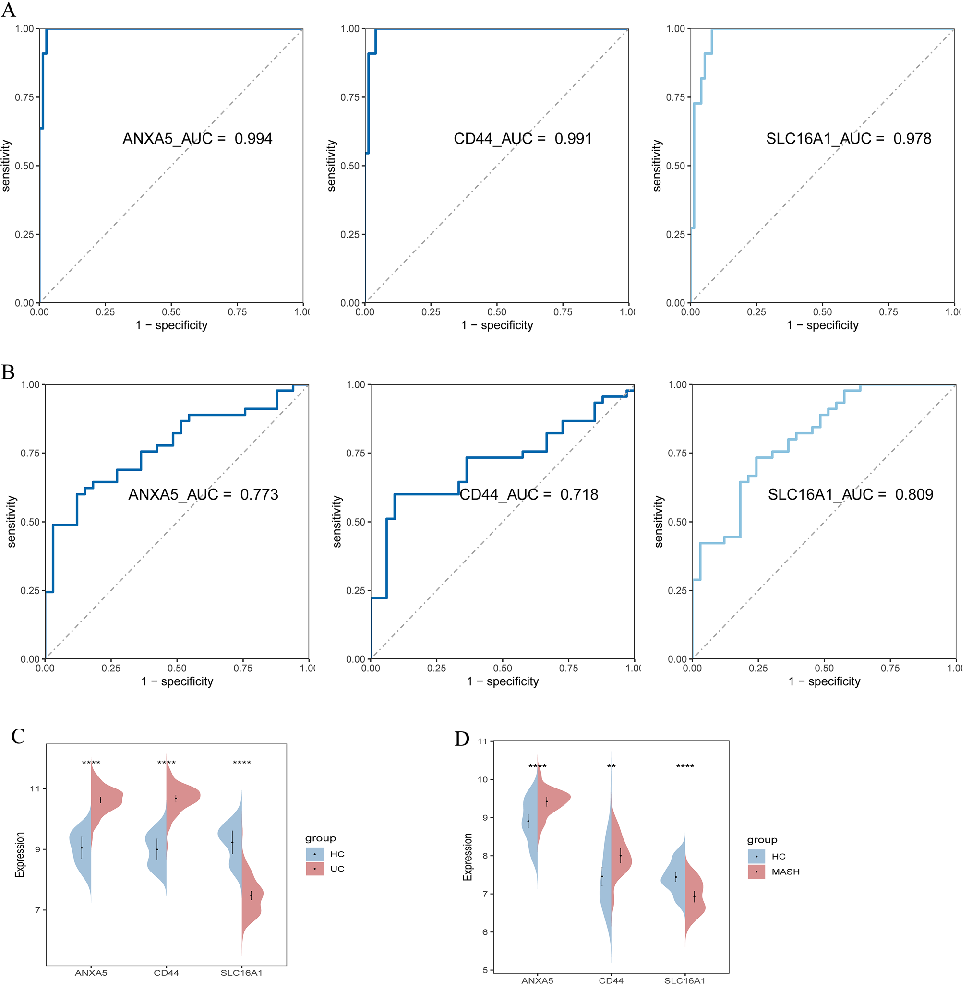
Diagnostic or prognostic model performance based on butyrate metabolism-related shared genes, using receiver operating characteristic curves or similar metrics.
Exploring the butyrate metabolism-related shared genes in metabolic associated steatohepatitis and ulcerative …
Correlation analysis between butyrate metabolism gene expression and clinical parameters in MASLD and colorectal cancer patient cohorts.
Exploring the butyrate metabolism-related shared genes in metabolic associated steatohepatitis and ulcerative …
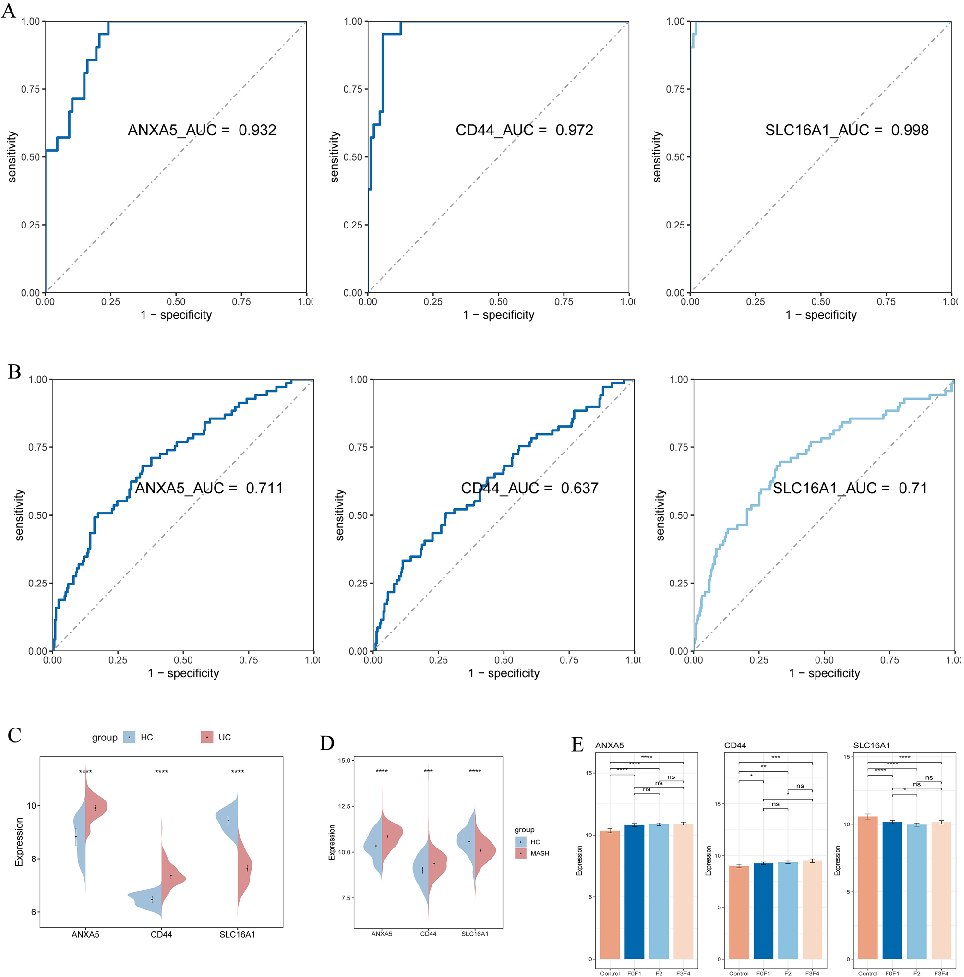
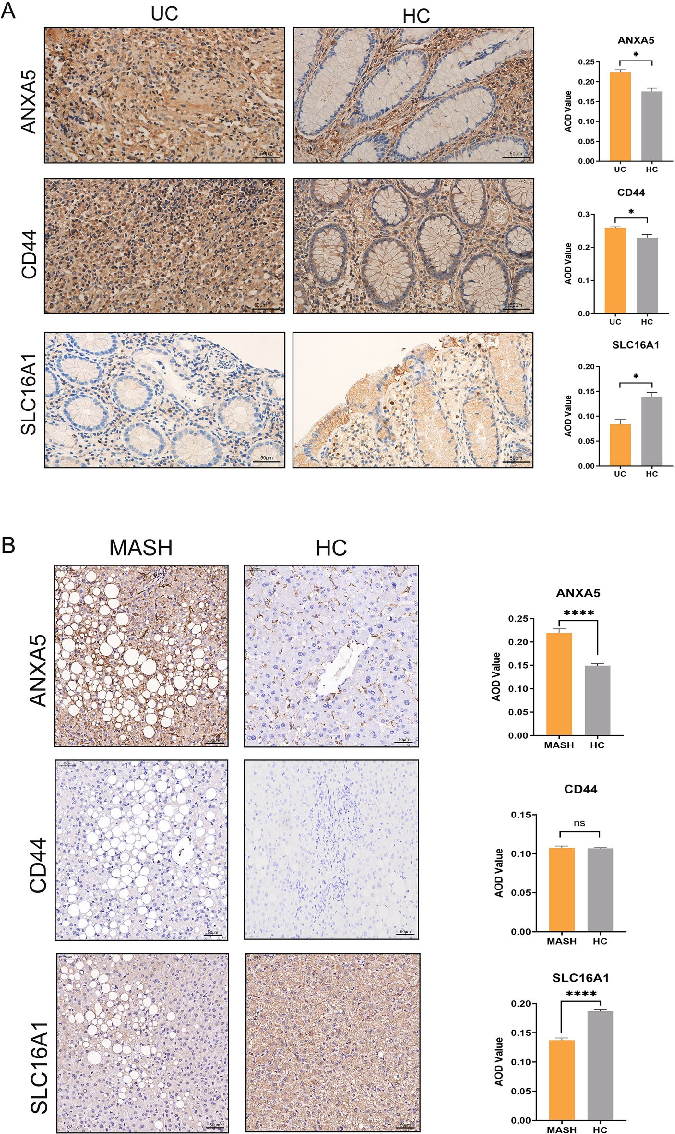
Validation analysis of the butyrate metabolism-related shared gene signatures in independent MASLD and colorectal cancer datasets.
Exploring the butyrate metabolism-related shared genes in metabolic associated steatohepatitis and ulcerative …
Drug sensitivity or molecular docking analysis targeting butyrate metabolism-related genes shared between MASLD and colorectal cancer.
Exploring the butyrate metabolism-related shared genes in metabolic associated steatohepatitis and ulcerative …
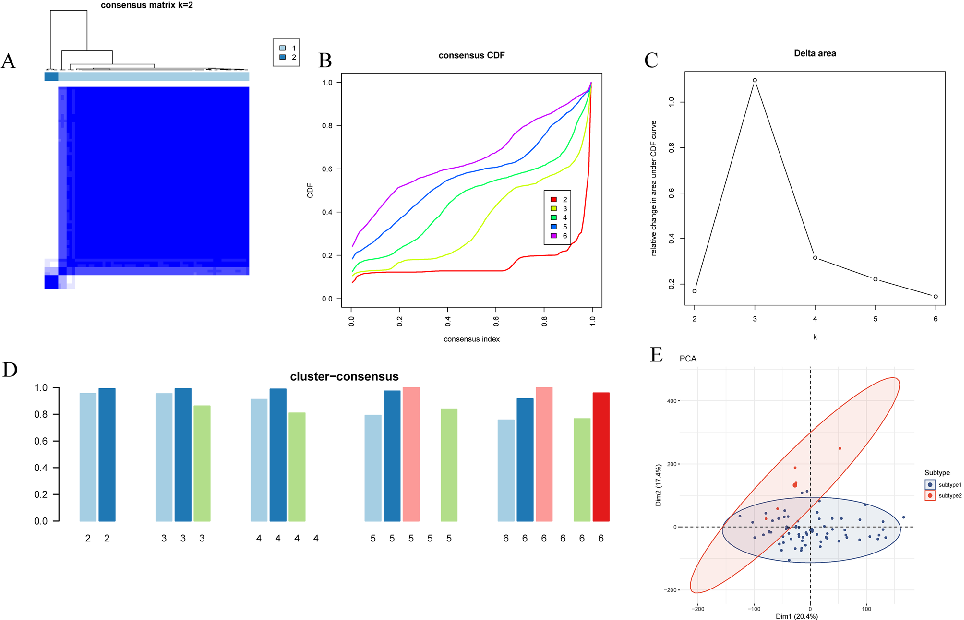
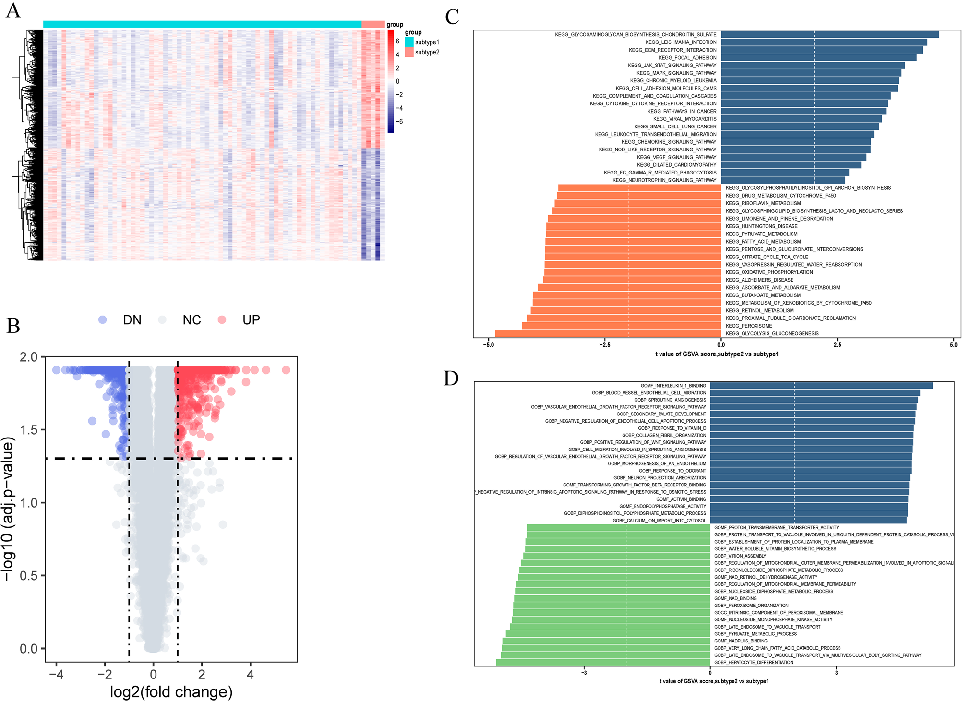
Single-cell or transcriptomic subtype analysis of butyrate metabolism-related gene expression patterns in MASLD and colorectal cancer tissues.
Exploring the butyrate metabolism-related shared genes in metabolic associated steatohepatitis and ulcerative …
Supplementary bioinformatic analysis supporting the role of butyrate metabolism as a molecular link between MASLD and colorectal cancer.
Exploring the butyrate metabolism-related shared genes in metabolic associated steatohepatitis and ulcerative …
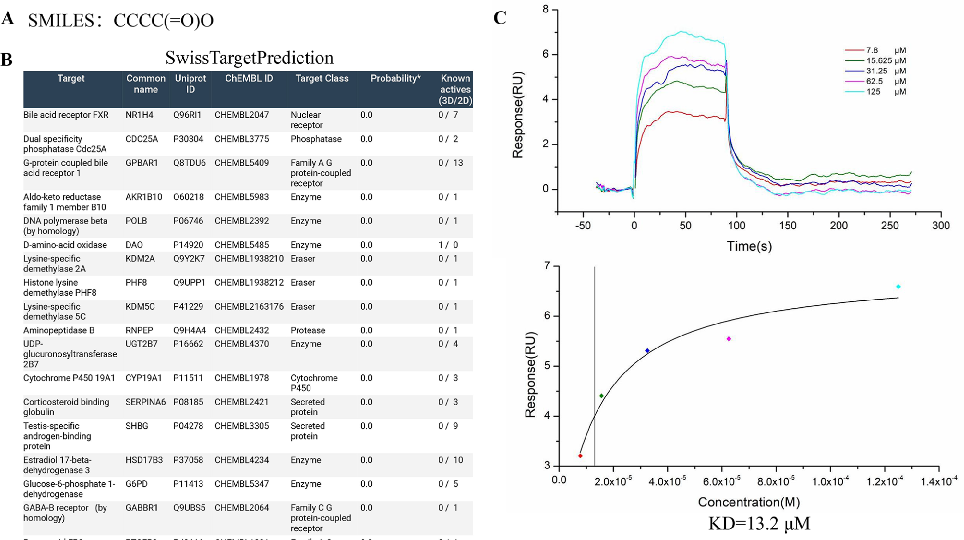
Sodium butyrate regulates macrophage polarization by TGR5/β-arrestin2 in vitro.
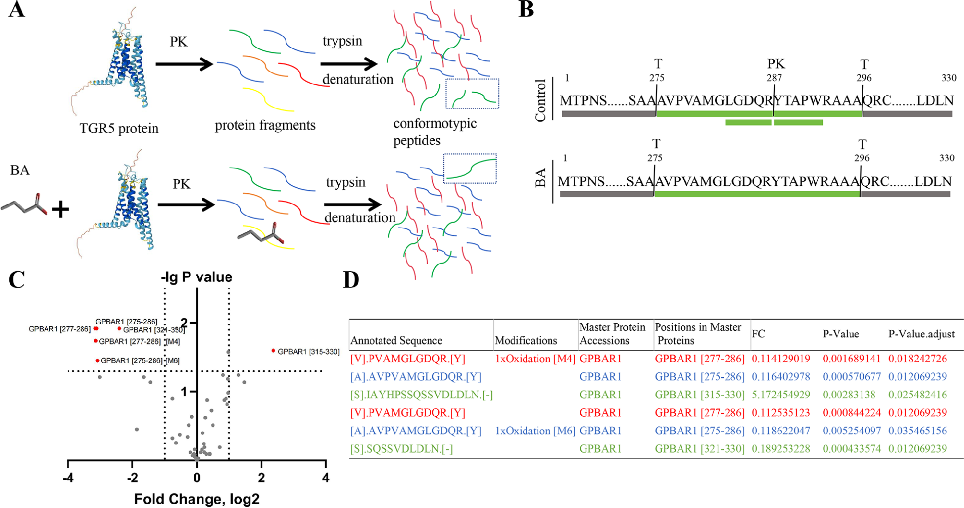
Sodium butyrate regulates macrophage polarization by TGR5/β-arrestin2 in vitro.
Sayfa 3 / 4