Processo de Pesquisa
477 figuras de pesquisa revisada por pares
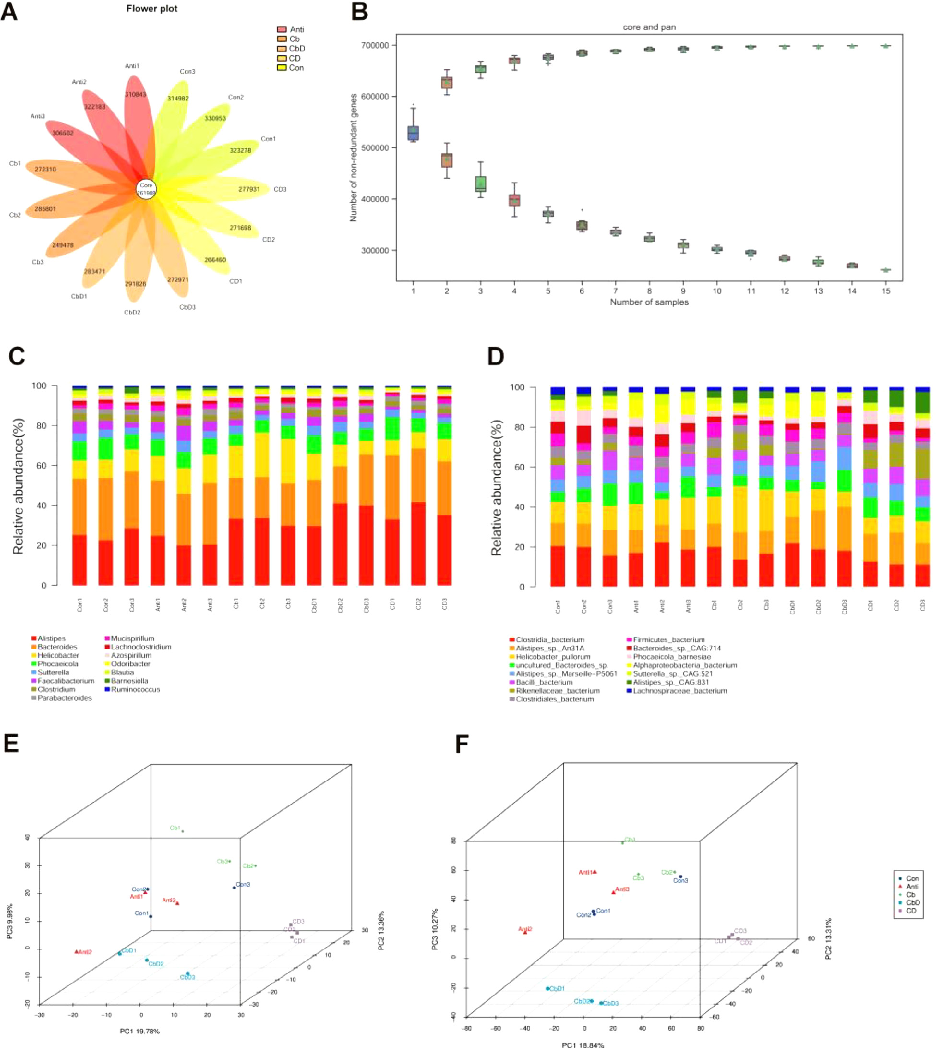
Metagenomic analysis of caecal microbiota in poultry receiving Clostridium butyricum and 25-hydroxyvitamin D3 supplementation, revealing shifts in microbial community structure.
Dietary Clostridium butyricum and 25-Hydroxyvitamin D3 modulate bone metabolism of broilers through …
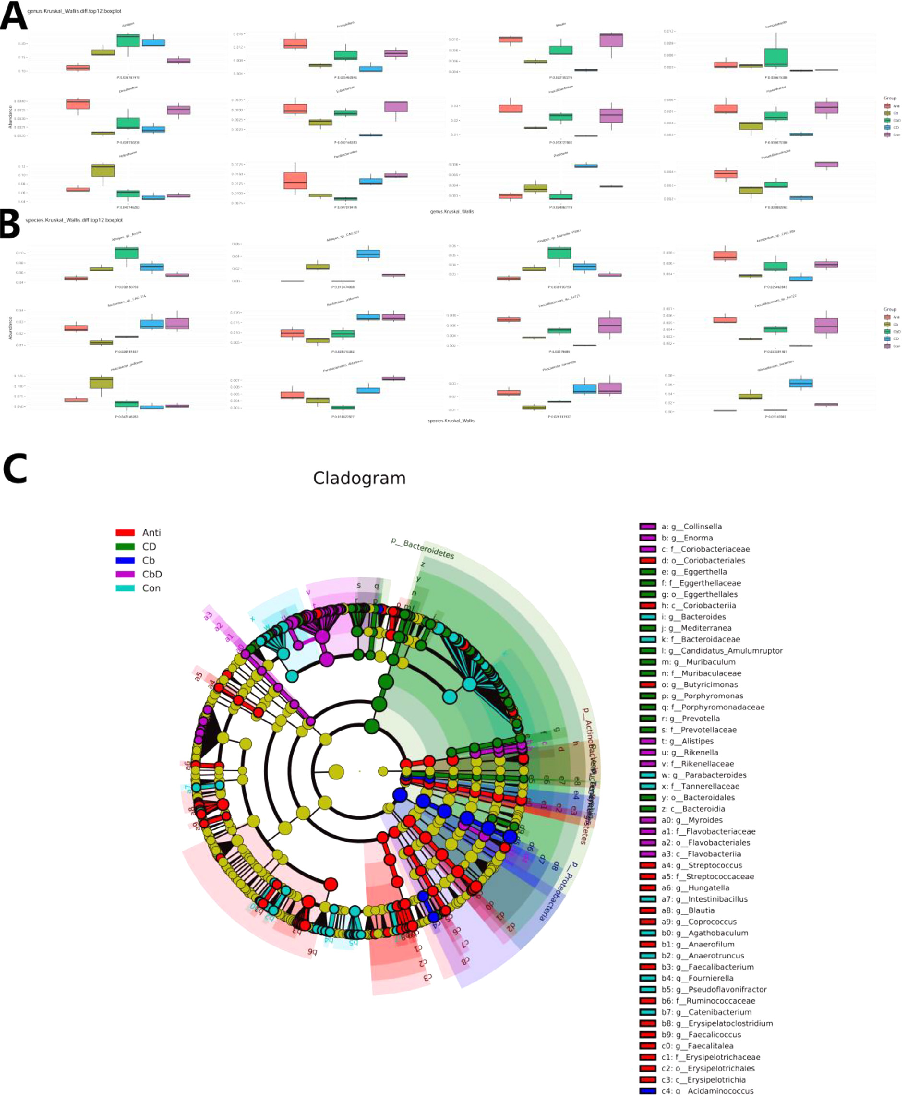
Caecal microbial composition data from poultry treated with Clostridium butyricum and 25-hydroxyvitamin D3, showing taxonomic-level changes associated with improved bone metabolism.
Dietary Clostridium butyricum and 25-Hydroxyvitamin D3 modulate bone metabolism of broilers through …
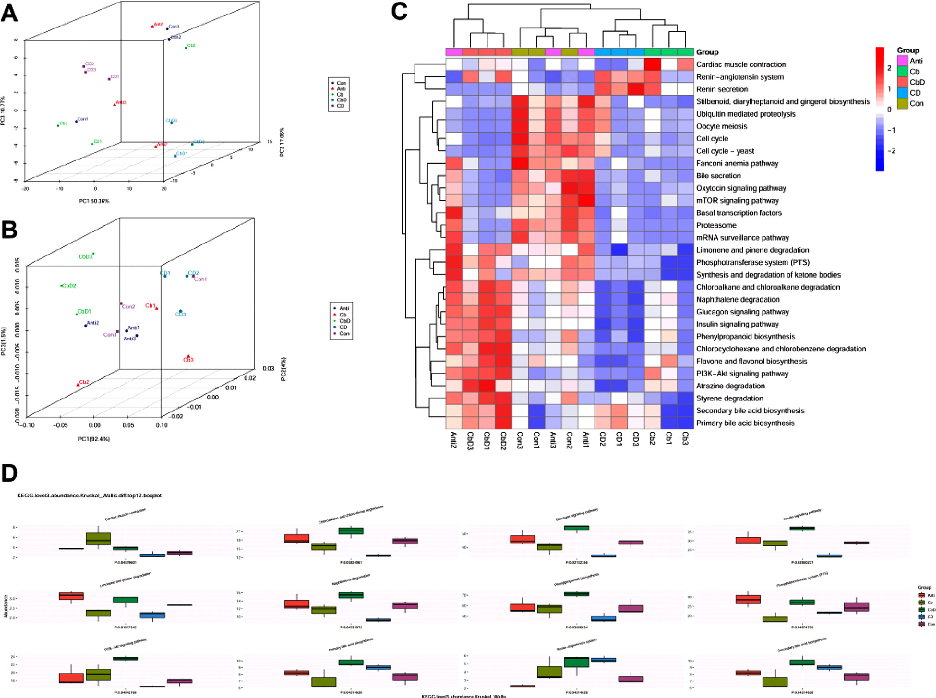
Metagenomic analysis of caecal microbiota in poultry receiving Clostridium butyricum and 25-hydroxyvitamin D3 supplementation, revealing shifts in microbial community structure.
Dietary Clostridium butyricum and 25-Hydroxyvitamin D3 modulate bone metabolism of broilers through …
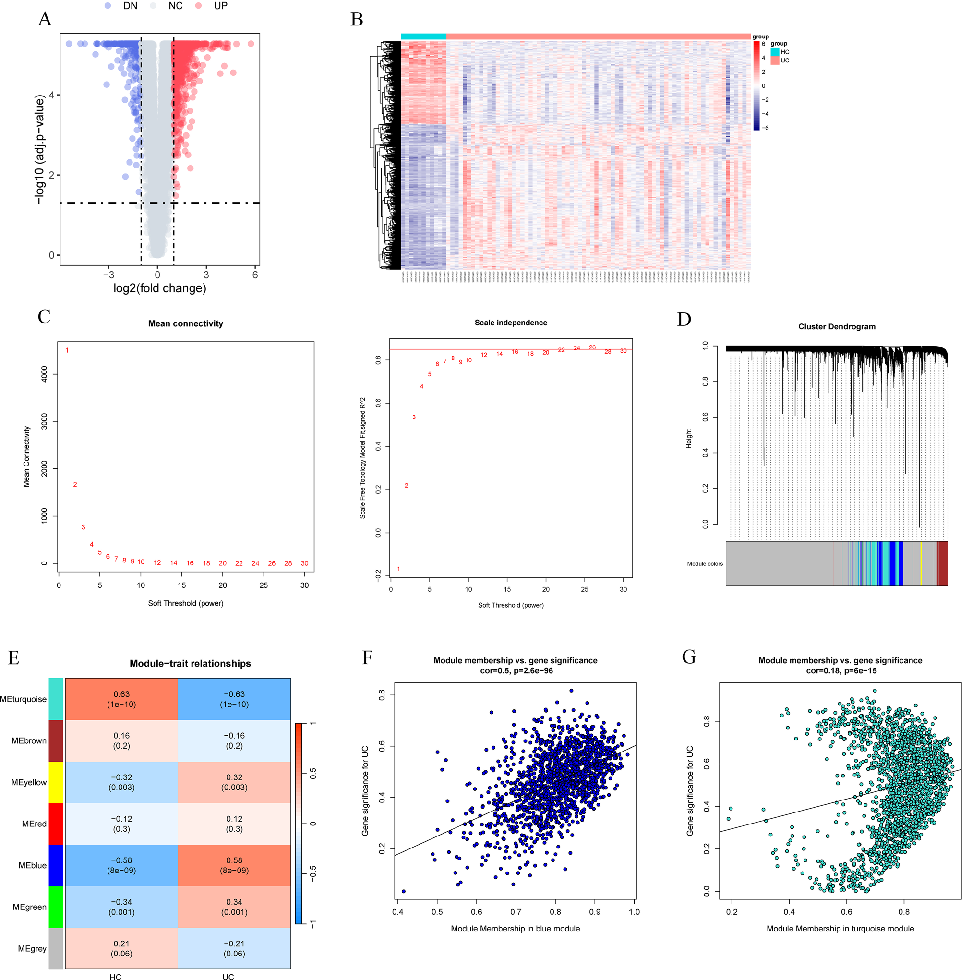
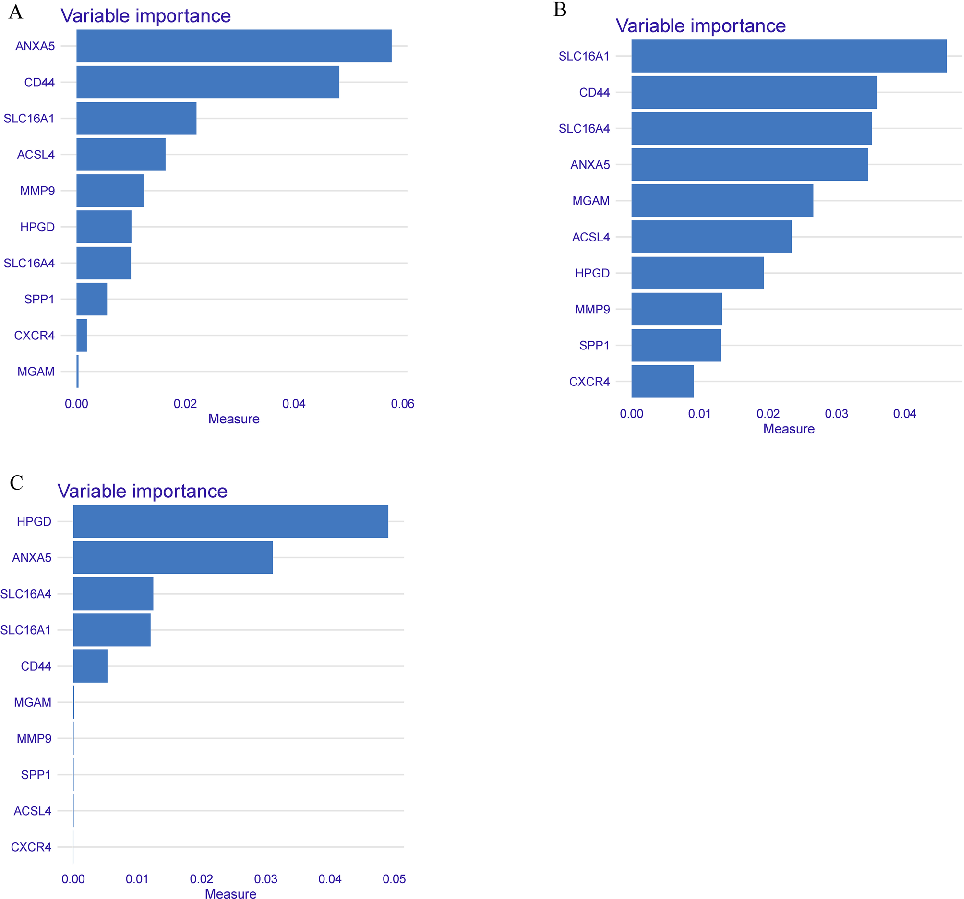
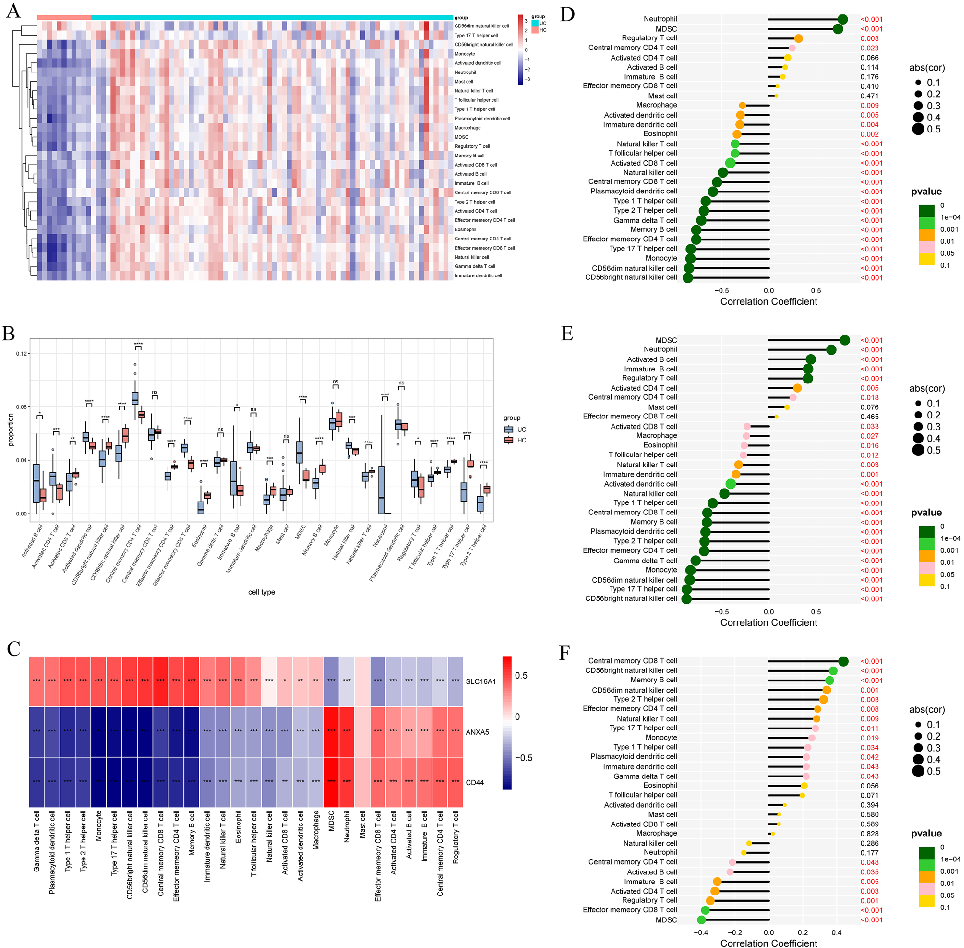
Identification of butyrate metabolism-related genes shared between metabolic-associated steatotic liver disease (MASLD) and colorectal cancer, using bioinformatic screening approaches.
Exploring the butyrate metabolism-related shared genes in metabolic associated steatohepatitis and ulcerative …
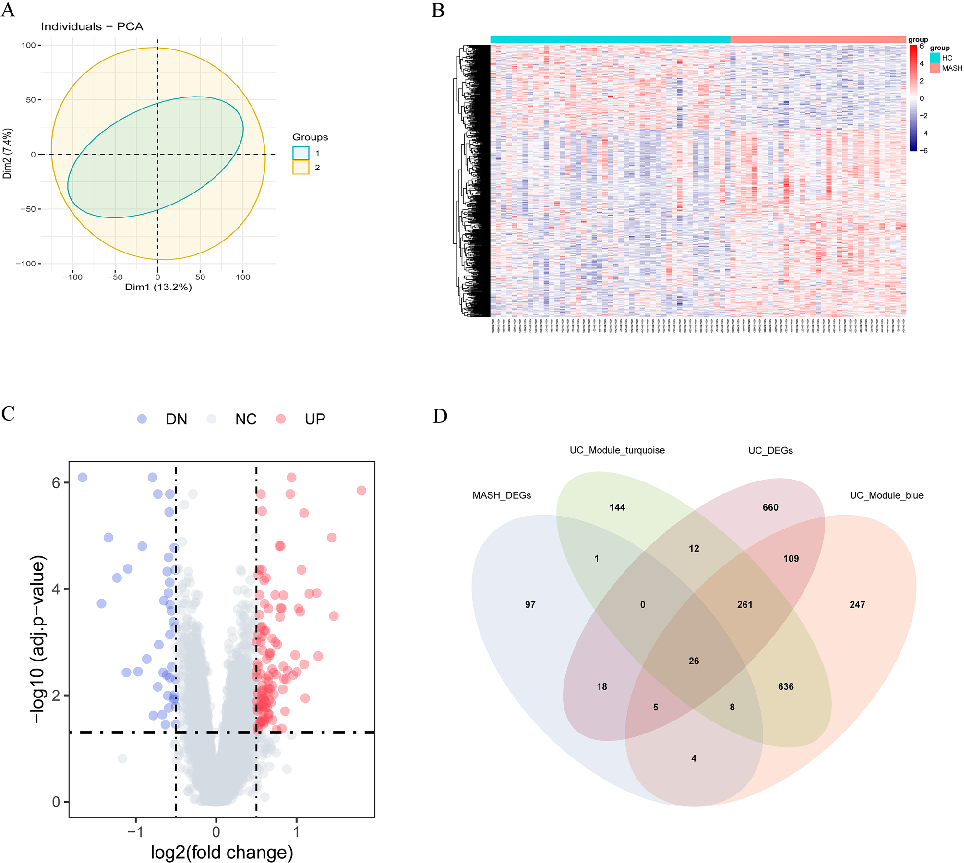
Gene expression analysis of butyrate metabolism-related shared genes across MASLD and colorectal cancer datasets, highlighting differential expression patterns.
Exploring the butyrate metabolism-related shared genes in metabolic associated steatohepatitis and ulcerative …
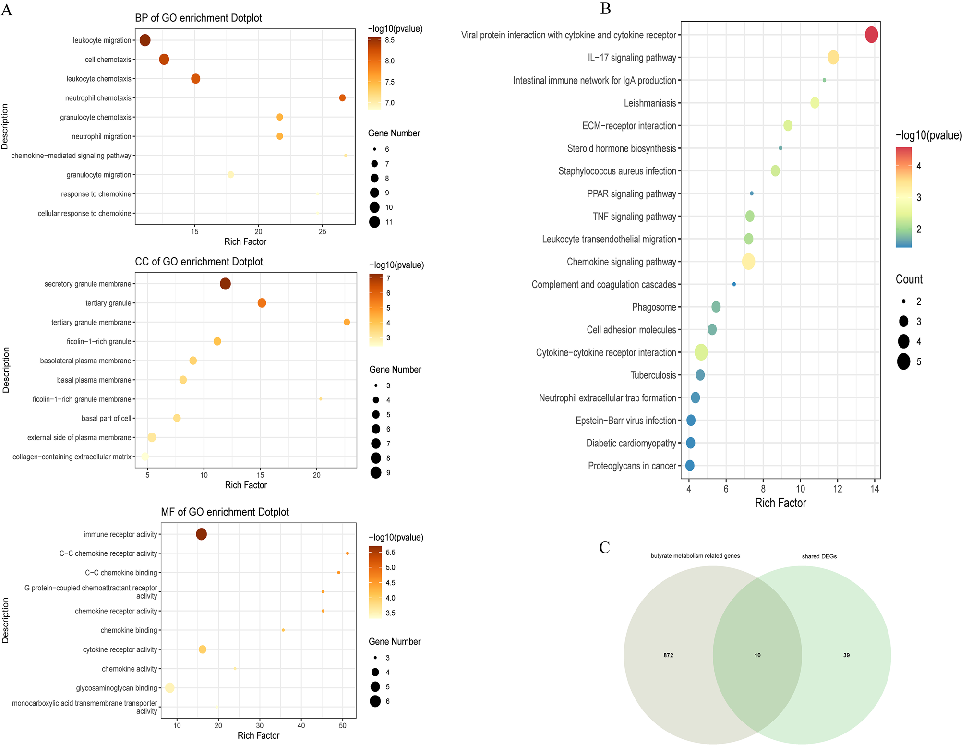
Functional enrichment analysis of the identified butyrate metabolism-related shared genes, mapping their involvement in key metabolic and immune pathways.
Exploring the butyrate metabolism-related shared genes in metabolic associated steatohepatitis and ulcerative …
Protein-protein interaction network of butyrate metabolism-related genes implicated in both MASLD and colorectal cancer pathogenesis.
Exploring the butyrate metabolism-related shared genes in metabolic associated steatohepatitis and ulcerative …
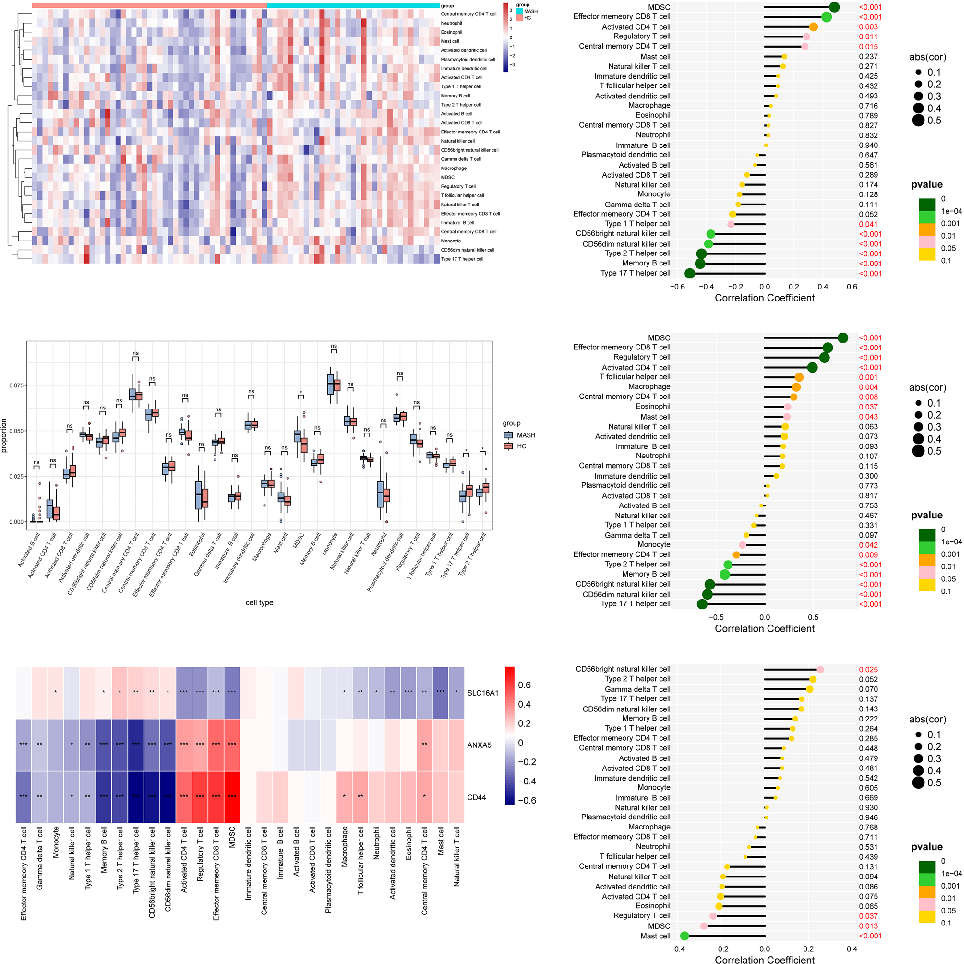
Immune cell infiltration analysis in MASLD and colorectal cancer tissues, correlating butyrate metabolism gene expression with immune microenvironment composition.
Exploring the butyrate metabolism-related shared genes in metabolic associated steatohepatitis and ulcerative …
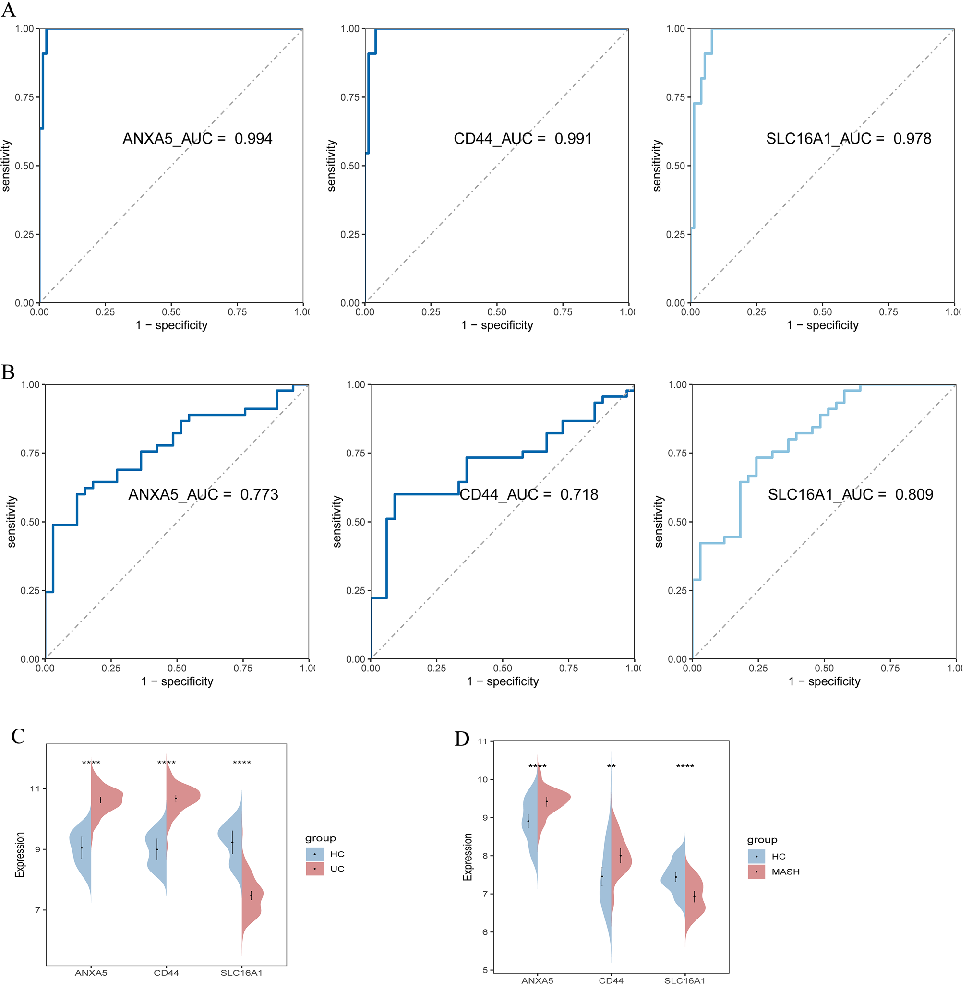
Diagnostic or prognostic model performance based on butyrate metabolism-related shared genes, using receiver operating characteristic curves or similar metrics.
Exploring the butyrate metabolism-related shared genes in metabolic associated steatohepatitis and ulcerative …
Correlation analysis between butyrate metabolism gene expression and clinical parameters in MASLD and colorectal cancer patient cohorts.
Exploring the butyrate metabolism-related shared genes in metabolic associated steatohepatitis and ulcerative …
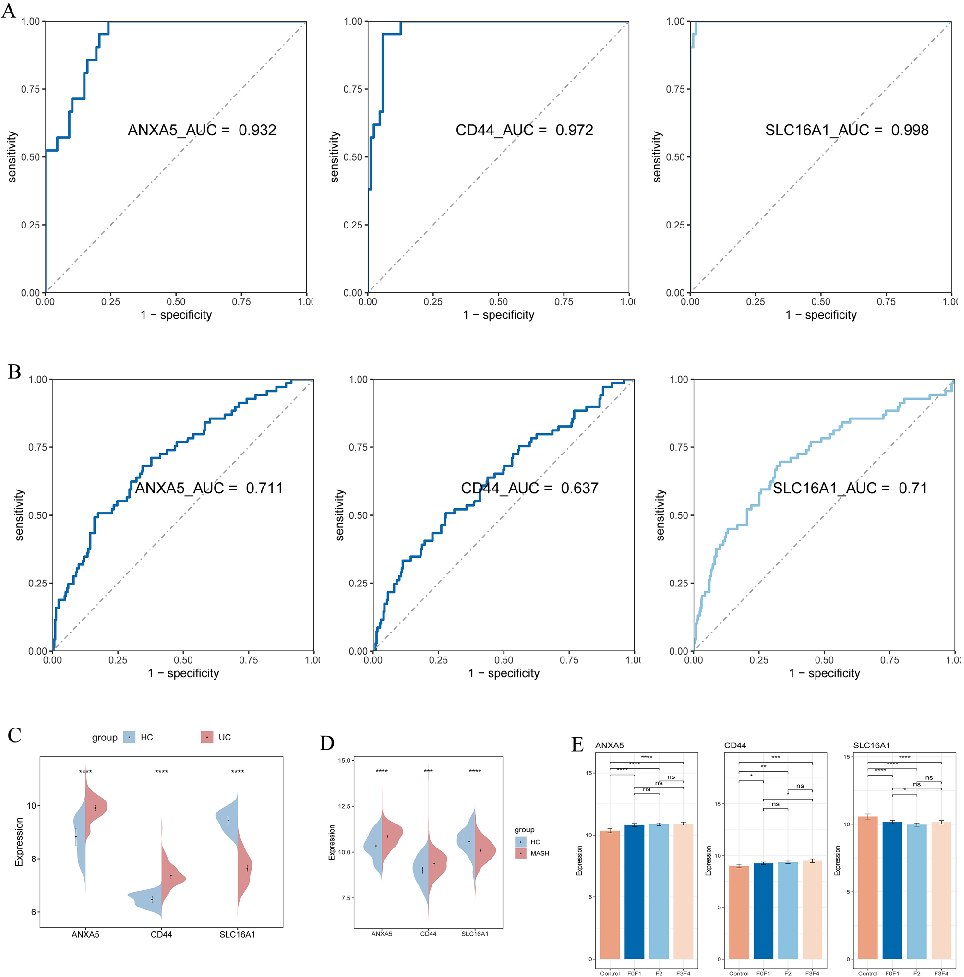
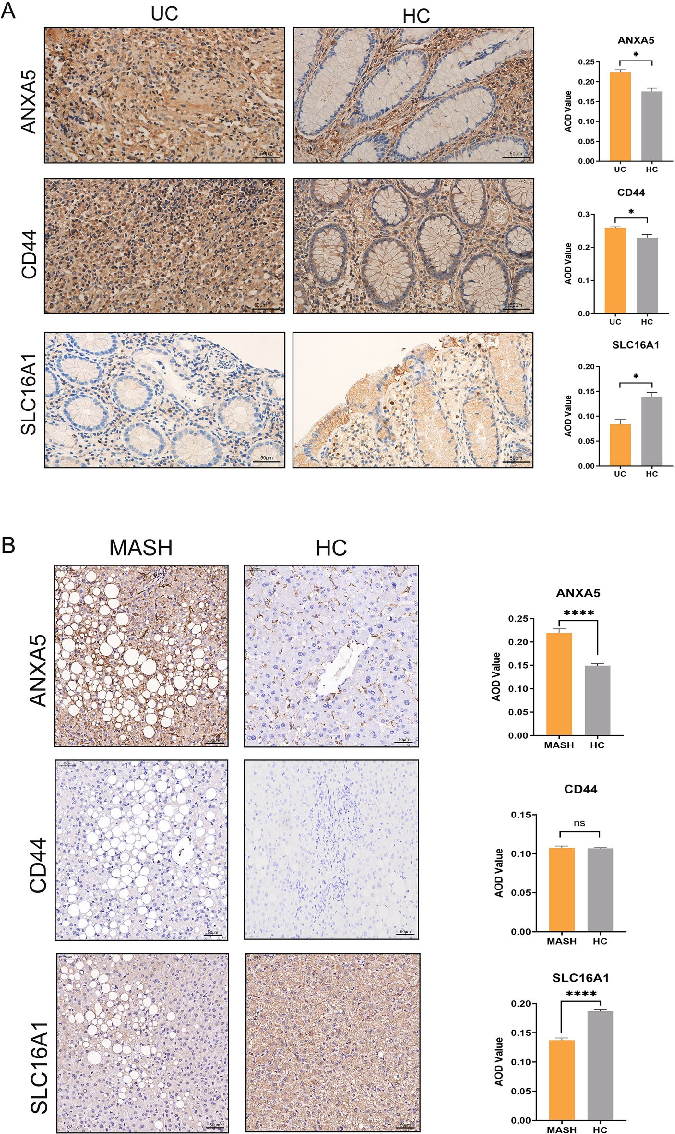
Validation analysis of the butyrate metabolism-related shared gene signatures in independent MASLD and colorectal cancer datasets.
Exploring the butyrate metabolism-related shared genes in metabolic associated steatohepatitis and ulcerative …
Drug sensitivity or molecular docking analysis targeting butyrate metabolism-related genes shared between MASLD and colorectal cancer.
Exploring the butyrate metabolism-related shared genes in metabolic associated steatohepatitis and ulcerative …
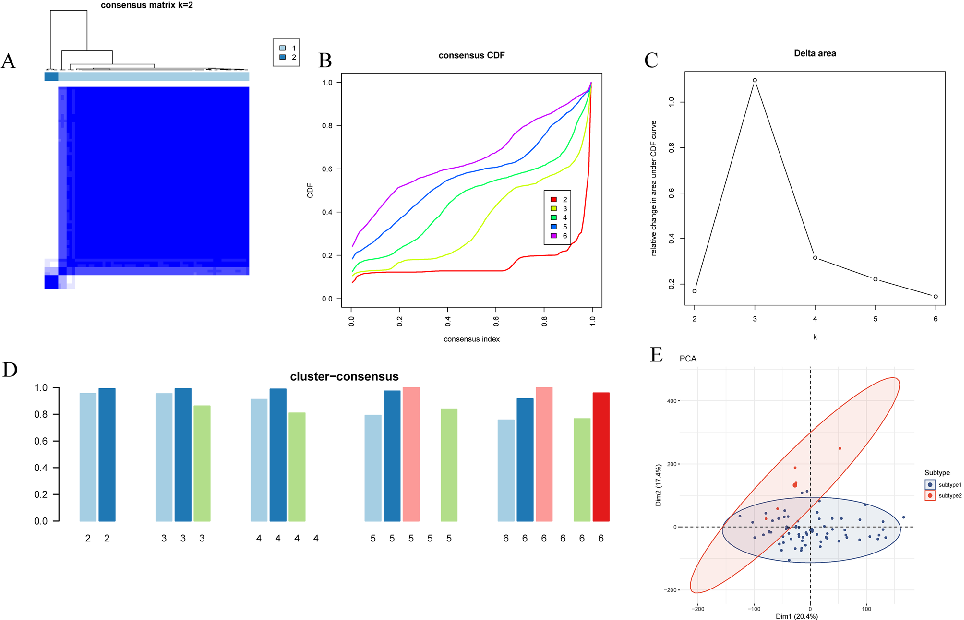
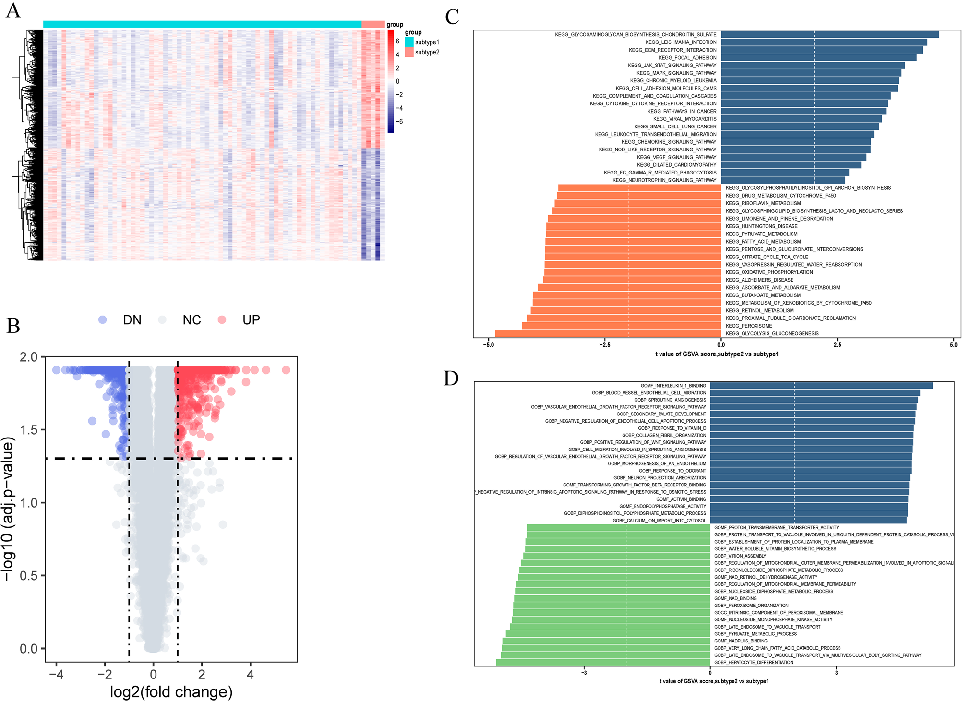
Single-cell or transcriptomic subtype analysis of butyrate metabolism-related gene expression patterns in MASLD and colorectal cancer tissues.
Exploring the butyrate metabolism-related shared genes in metabolic associated steatohepatitis and ulcerative …
Supplementary bioinformatic analysis supporting the role of butyrate metabolism as a molecular link between MASLD and colorectal cancer.
Exploring the butyrate metabolism-related shared genes in metabolic associated steatohepatitis and ulcerative …
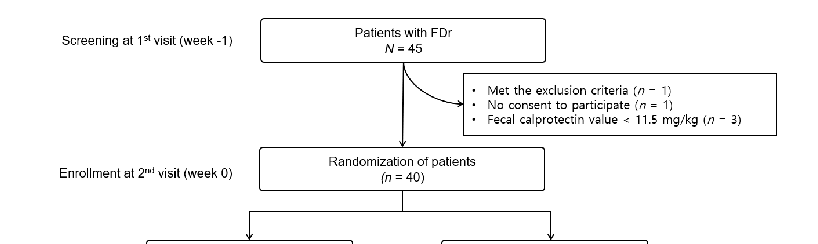
A Randomized, Double-Blind, Placebo-Controlled Trial to Evaluate the Effects of Multi-Strain Synbiotic …
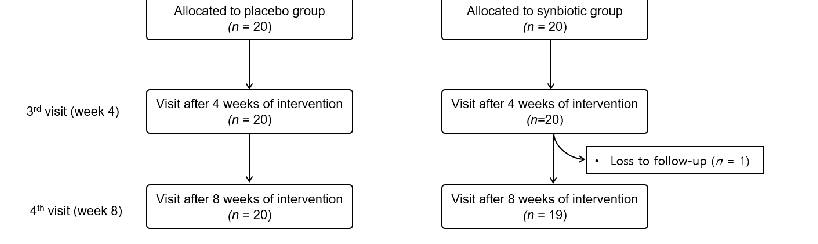
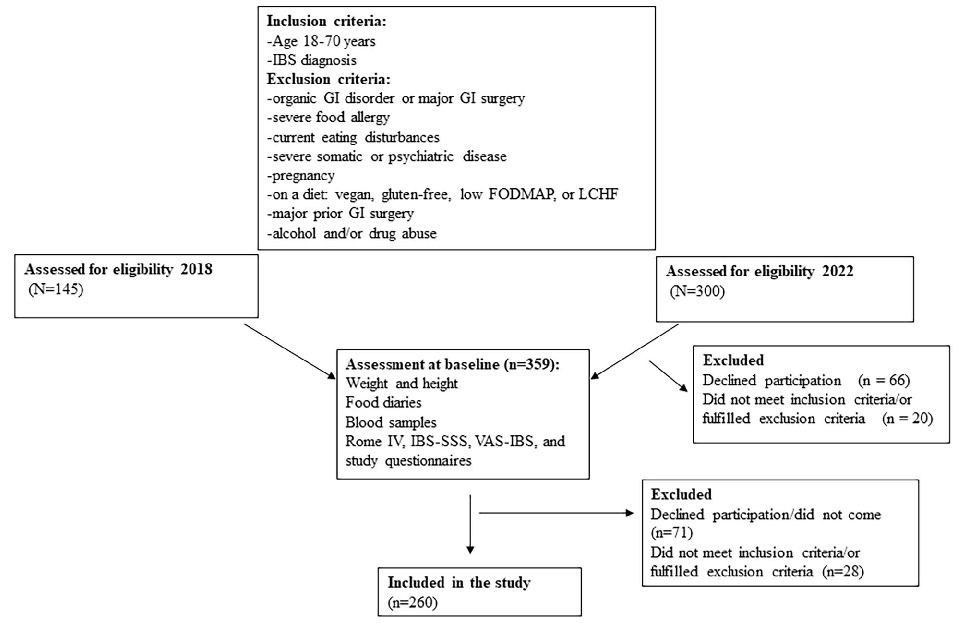
Figure 1. Flow diagram showing the selection of subjects for this study. FDr, functional diarrhea.
A Randomized, Double-Blind, Placebo-Controlled Trial to Evaluate the Effects of Multi-Strain Synbiotic …
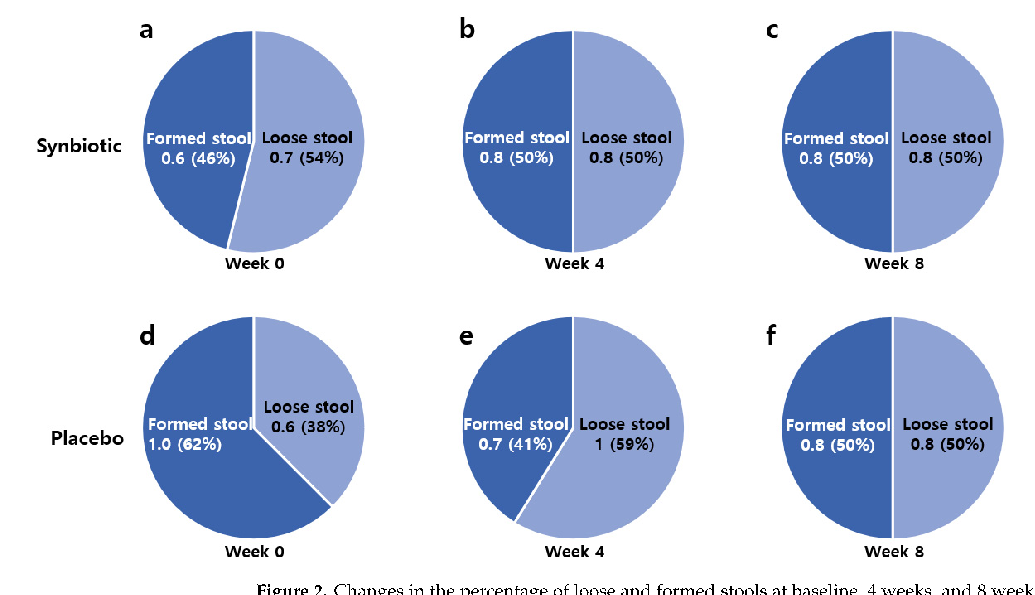
Figure 2. Changes in the percentage of loose and formed stools at baseline, 4 weeks, and 8 weeks after intervention. Changes in the proportion of formed and loose stools at …
A Randomized, Double-Blind, Placebo-Controlled Trial to Evaluate the Effects of Multi-Strain Synbiotic …
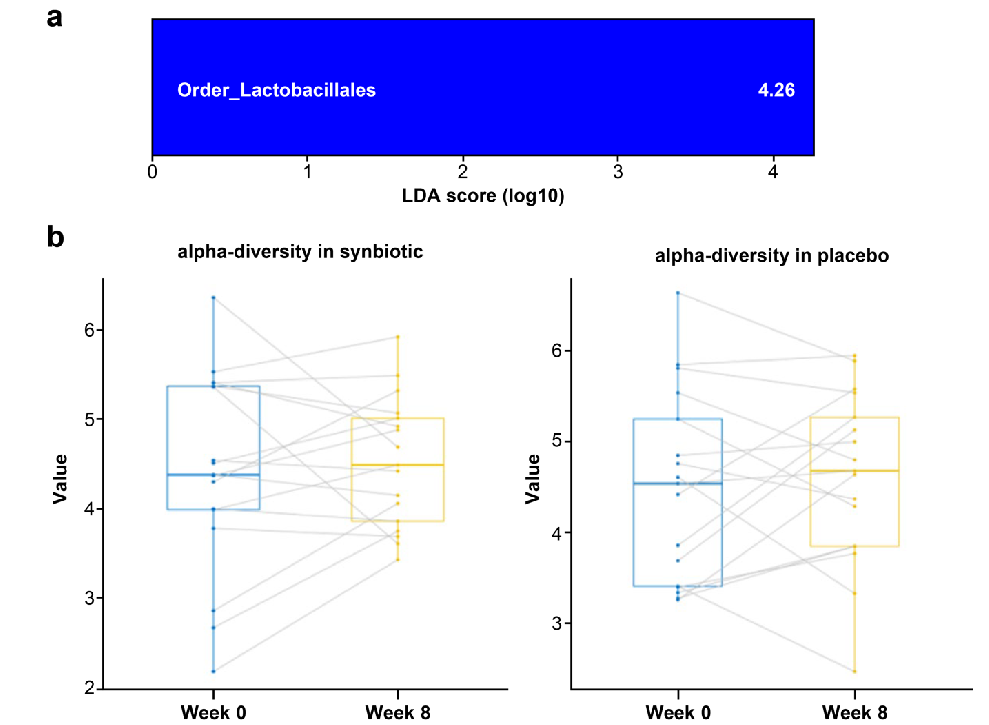
A Randomized, Double-Blind, Placebo-Controlled Trial to Evaluate the Effects of Multi-Strain Synbiotic …
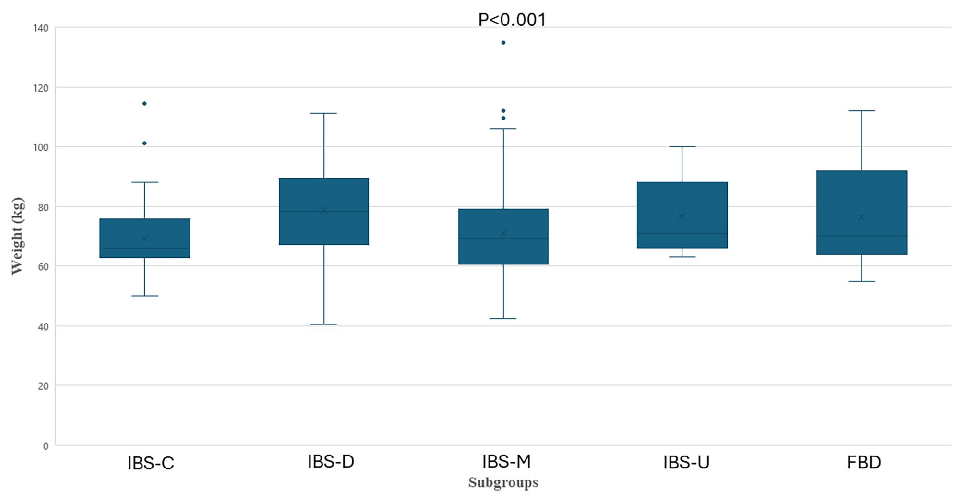
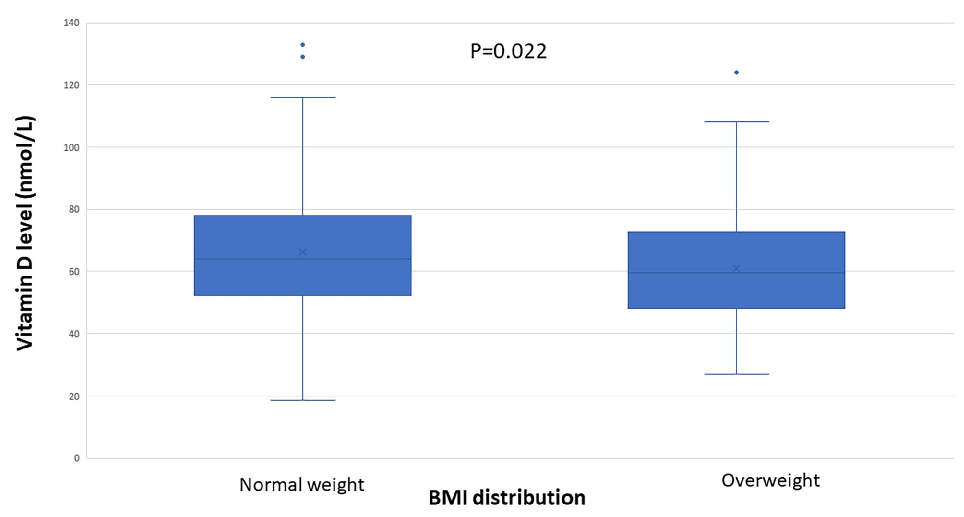
Overweight and vitamin D deficiency are common in patients with irritable bowel …
*= combination pills. Values are given as number (percentage). Differences were calculated between the two IBS cohorts by Fisher´s exact test. P< 0.05 was considered statistically significant
Overweight and vitamin D deficiency are common in patients with irritable bowel …
Overweight and vitamin D deficiency are common in patients with irritable bowel …
Overweight and vitamin D deficiency are common in patients with irritable bowel …
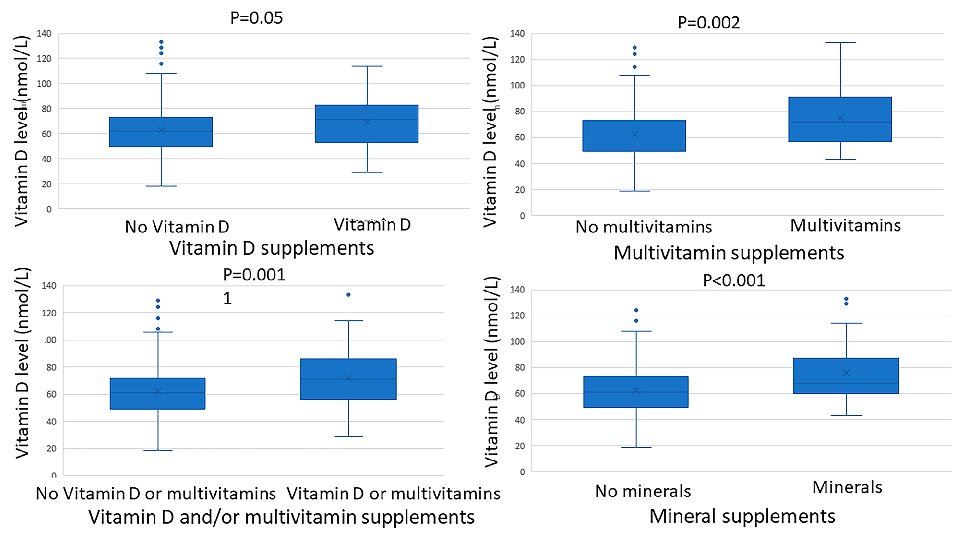
Overweight and vitamin D deficiency are common in patients with irritable bowel …
Scheme 1.Flowchart 1:The coding for mucopenetrative liposomal formulation compositions (MP1-MP6).The coding for mucopenetrative liposomal formulation compositions (MP1-MP6).
Liposomal Drug Delivery against Helicobacter pylori Using Furazolidone and N-Acetyl Cysteine in …
Página 17 de 20