Processo di ricerca
477 figure da ricerca revisionata da esperti
The intestinal microbiota in ulcerative colitis patients shows characteristic dysbiosis patterns, with reduced microbial diversity and altered composition compared to healthy individuals. Key bacterial phyla such as Firmicutes and Bacteroidetes are disproportionately affected.
Relationship between intestinal microbiota and ulcerative colitis: Mechanisms and clinical application of …
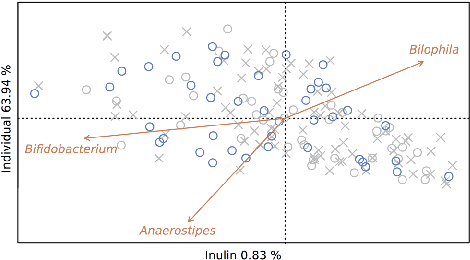
Metabolomic analysis of fecal samples following inulin intervention reveals significant changes in short-chain fatty acid profiles, particularly increased butyrate and propionate concentrations. These metabolic shifts correlate with specific microbial community changes.
Prebiotic inulin-type fructans induce specific changes in the human gut microbiota.
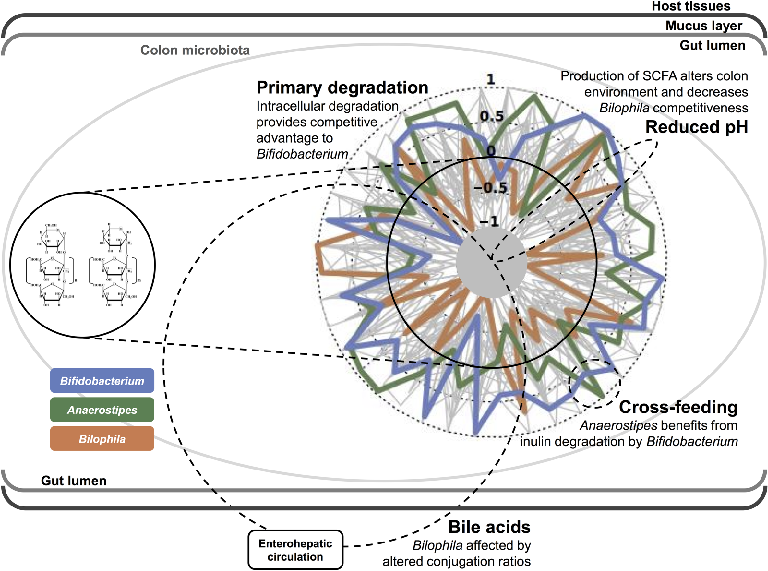
Gut microbiota composition changes induced by inulin-type fructans are characterized by increased abundance of Bifidobacterium, Faecalibacterium, and Anaerostipes, alongside decreased levels of Bilophila. These shifts are associated with altered fecal metabolite profiles.
Prebiotic inulin-type fructans induce specific changes in the human gut microbiota.
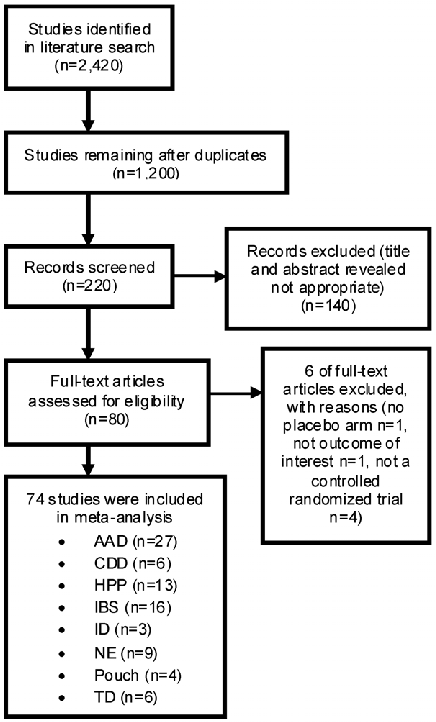
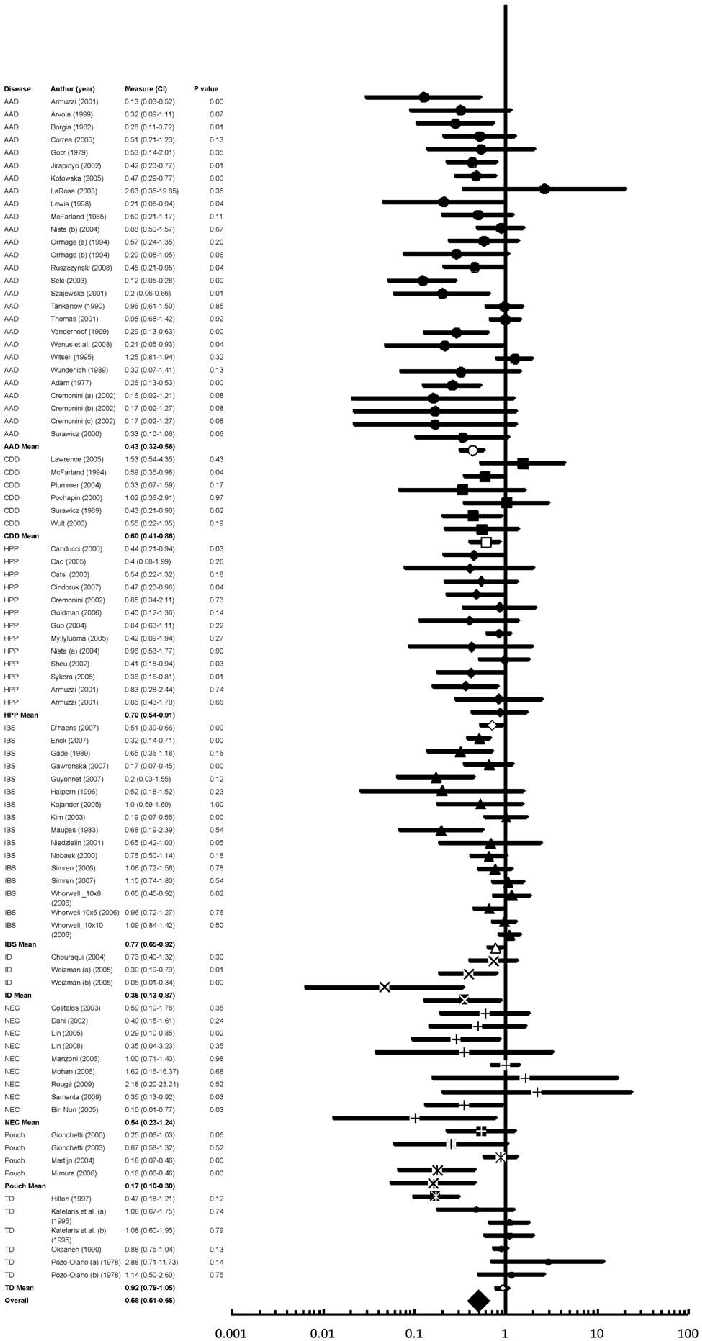
Forest plot summarizing the pooled efficacy of probiotic interventions across multiple gastrointestinal conditions, with odds ratios and confidence intervals for each included trial.
A meta-analysis of probiotic efficacy for gastrointestinal diseases.
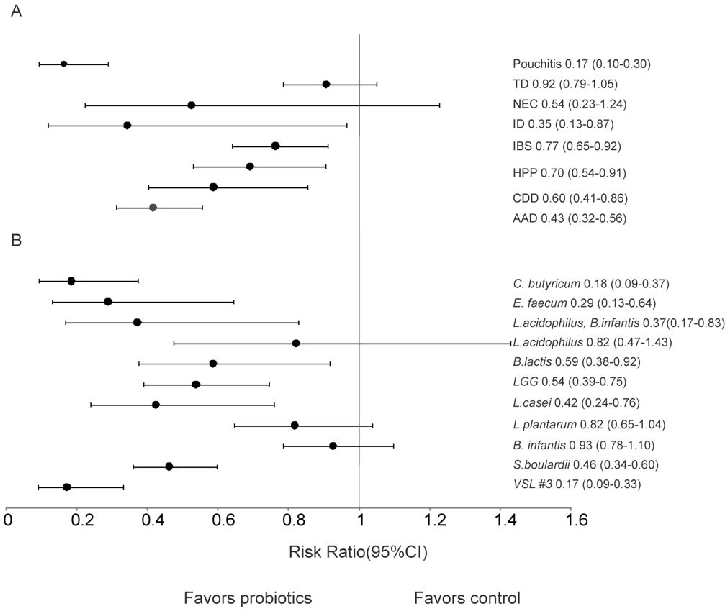
Subgroup analysis by probiotic strain type reveals differential efficacy, with Lactobacillus and Saccharomyces species showing the strongest associations with symptom improvement.
A meta-analysis of probiotic efficacy for gastrointestinal diseases.
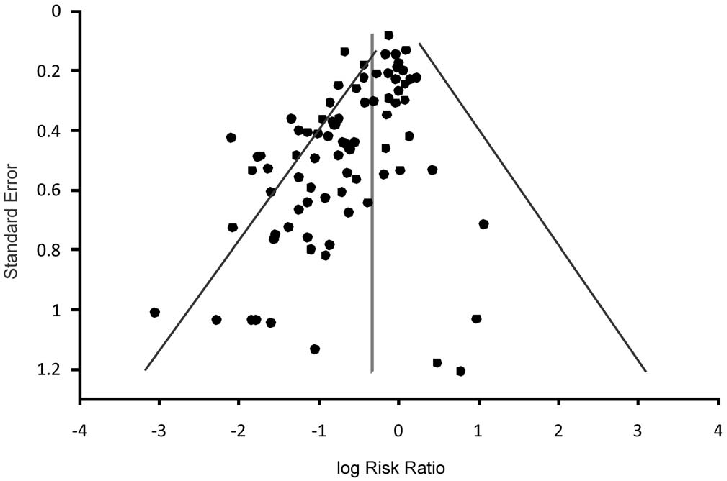
Funnel plot assessment for publication bias in the probiotic meta-analysis indicates generally symmetric distribution of effect sizes around the pooled estimate.
A meta-analysis of probiotic efficacy for gastrointestinal diseases.
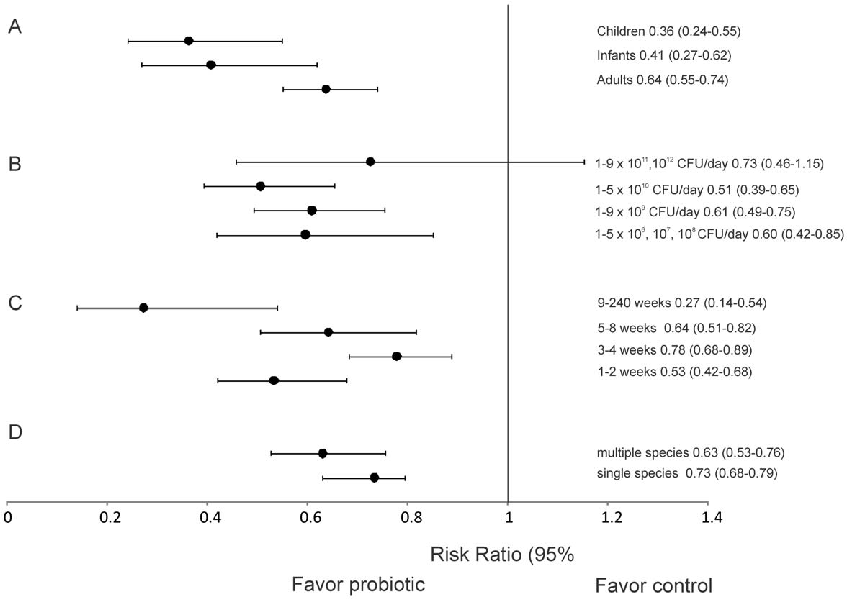
Stratified forest plot examining probiotic efficacy specifically in antibiotic-associated diarrhea trials shows a significant protective effect compared to placebo.
A meta-analysis of probiotic efficacy for gastrointestinal diseases.
Sensitivity analysis removing individual studies demonstrates that the overall positive association between probiotic supplementation and gastrointestinal symptom relief remains robust.
A meta-analysis of probiotic efficacy for gastrointestinal diseases.
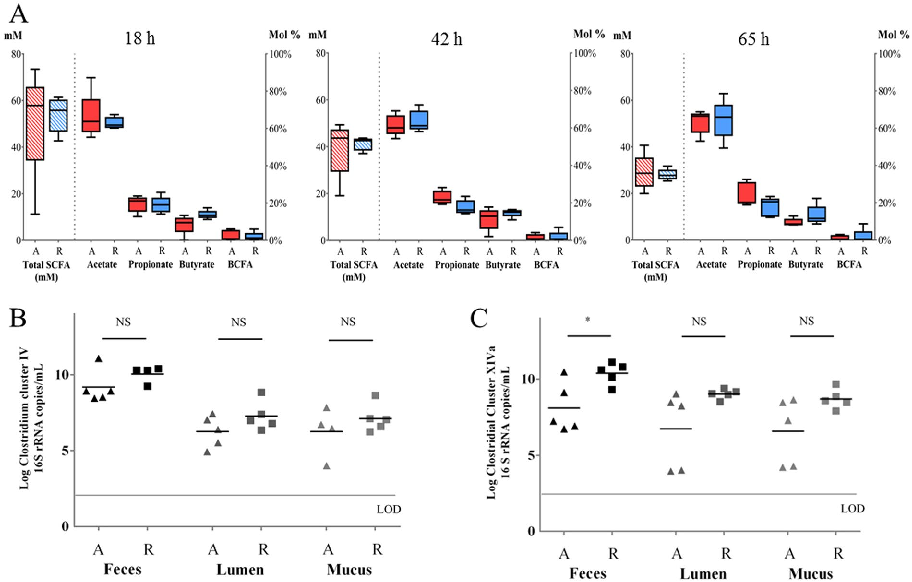
Butyrate and other short-chain fatty acid concentrations measured in the in vitro fermentation model show significant increases following supplementation with targeted bacterial strains.
Butyrate-producing bacteria supplemented in vitro to Crohn's disease patient microbiota increased butyrate …
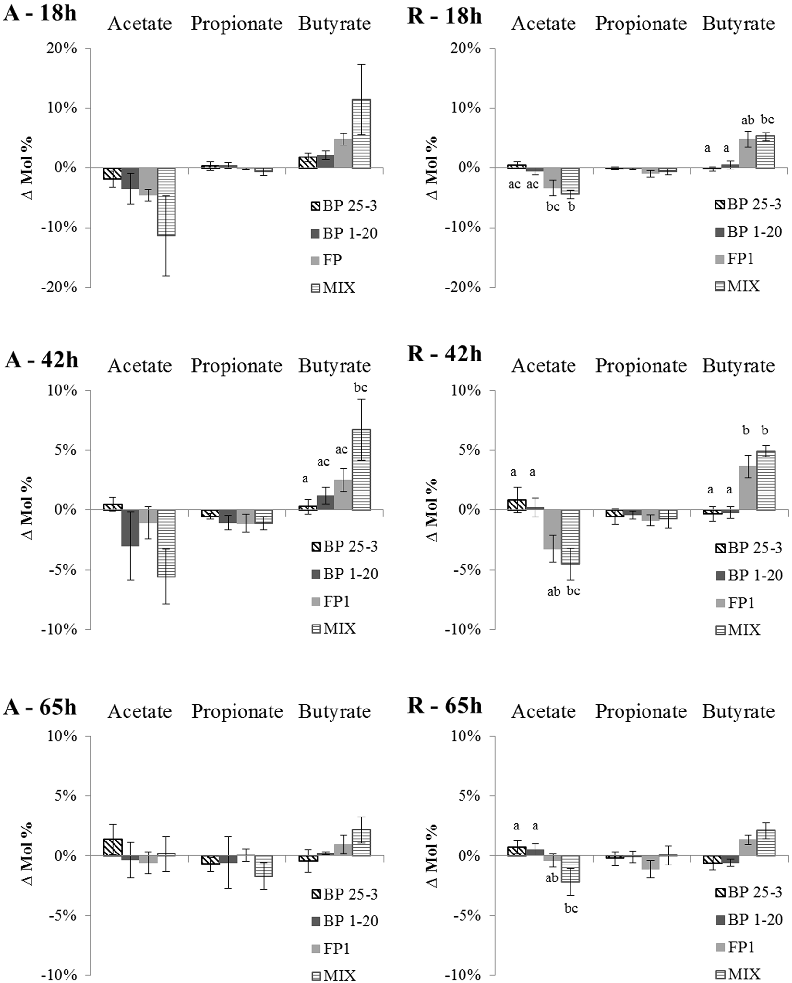
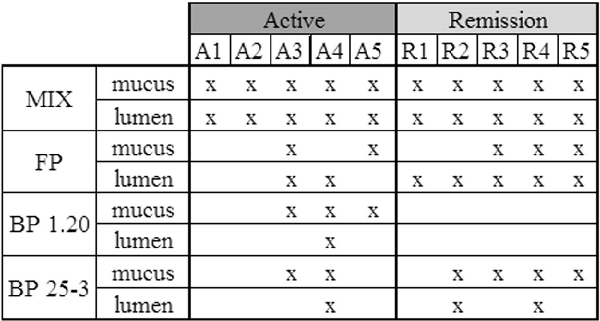
Relative abundance shifts in key bacterial taxa after supplementation are displayed, highlighting the engraftment success of introduced butyrate producers.
Butyrate-producing bacteria supplemented in vitro to Crohn's disease patient microbiota increased butyrate …
pH changes and metabolite profiles in the fermentation vessel over time demonstrate the metabolic impact of butyrate-producing bacterial supplementation.
Butyrate-producing bacteria supplemented in vitro to Crohn's disease patient microbiota increased butyrate …
Diversity indices comparing baseline Crohn's disease microbiota to supplemented samples suggest partial restoration of microbial community richness.
Butyrate-producing bacteria supplemented in vitro to Crohn's disease patient microbiota increased butyrate …
Correlation analysis between butyrate concentration increases and shifts in specific bacterial genera reveals ecological relationships within the supplemented microbiota.
Butyrate-producing bacteria supplemented in vitro to Crohn's disease patient microbiota increased butyrate …
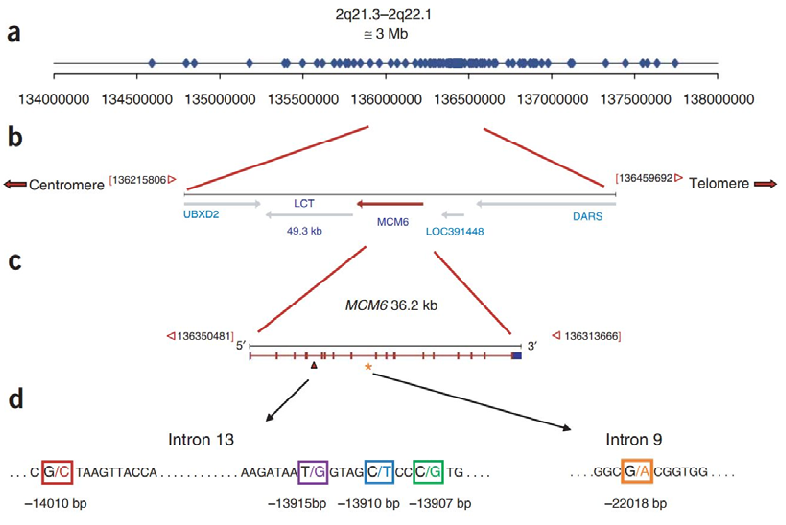
Genetic map of the lactase (LCT) and MCM6 gene region displays the locations of key single nucleotide polymorphisms associated with lactase persistence and non-persistence phenotypes across populations.
Lactose Intolerance in Adults: Biological Mechanism and Dietary Management.
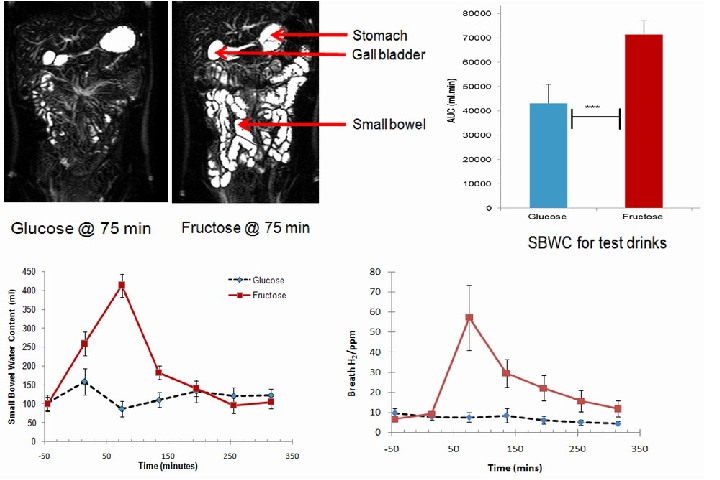
Small bowel water content and breath hydrogen concentrations after consuming glucose and fructose drinks are plotted over time, providing reference data for comparison with lactose challenge tests.
Lactose Intolerance in Adults: Biological Mechanism and Dietary Management.
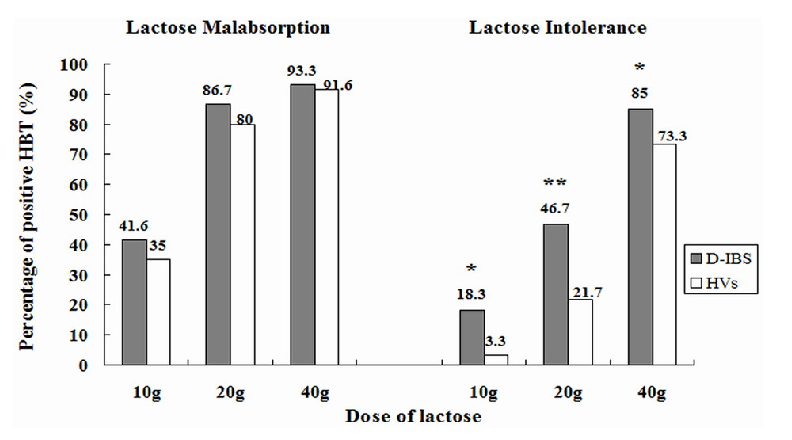
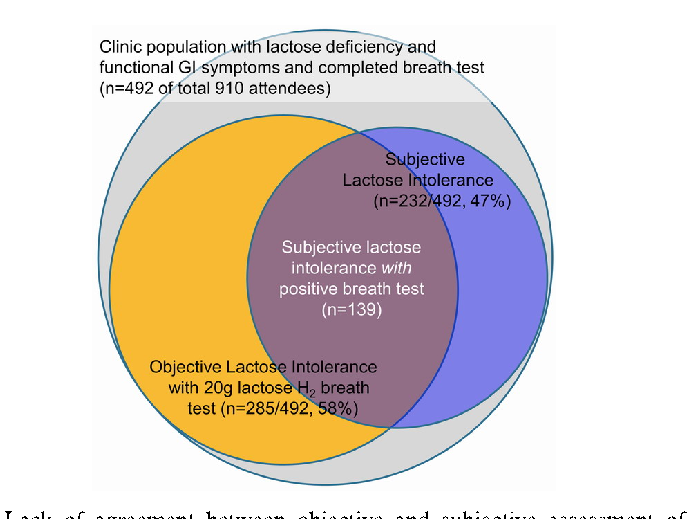
Prevalence of lactose malabsorption versus symptomatic lactose intolerance in IBS-D patients is compared, demonstrating that malabsorption does not invariably produce clinical symptoms.
Lactose Intolerance in Adults: Biological Mechanism and Dietary Management.
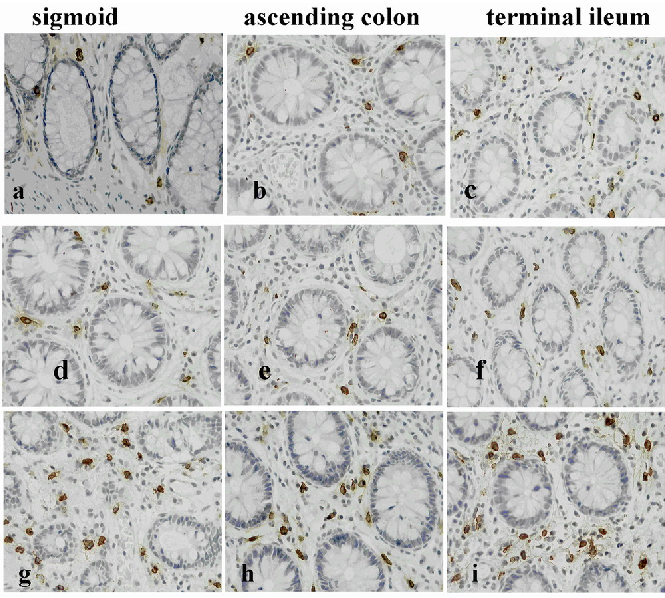
Representative photomicrographs of tryptase-positive mast cells in colonic mucosa compare healthy controls with IBS-D patients, suggesting mast cell involvement in lactose intolerance symptomatology.
Lactose Intolerance in Adults: Biological Mechanism and Dietary Management.
Dietary management strategies for lactose intolerance are summarized, including enzyme supplementation, dairy product selection, and gradual tolerance-building approaches.
Lactose Intolerance in Adults: Biological Mechanism and Dietary Management.
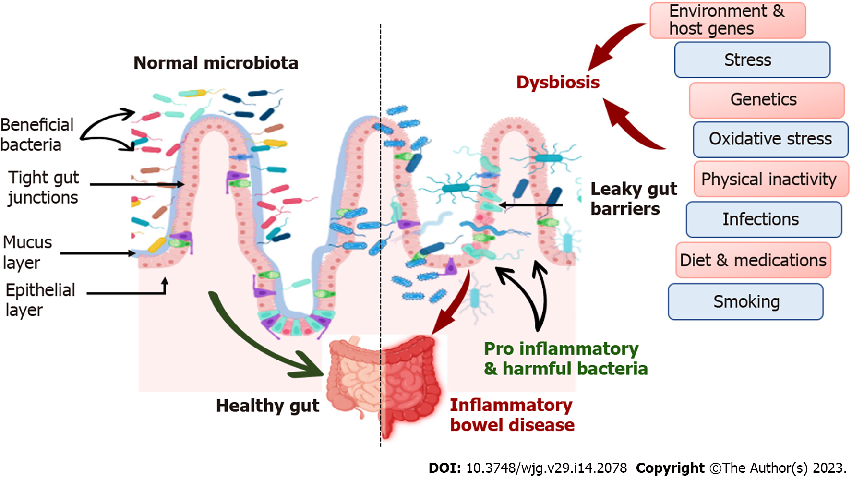
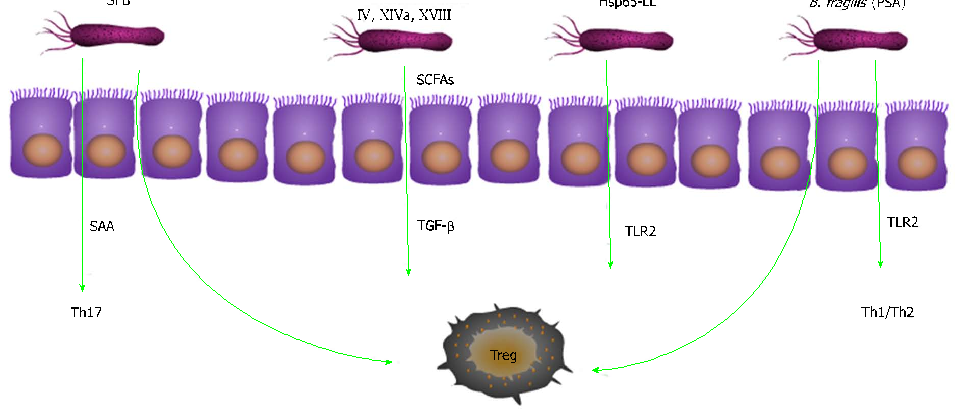
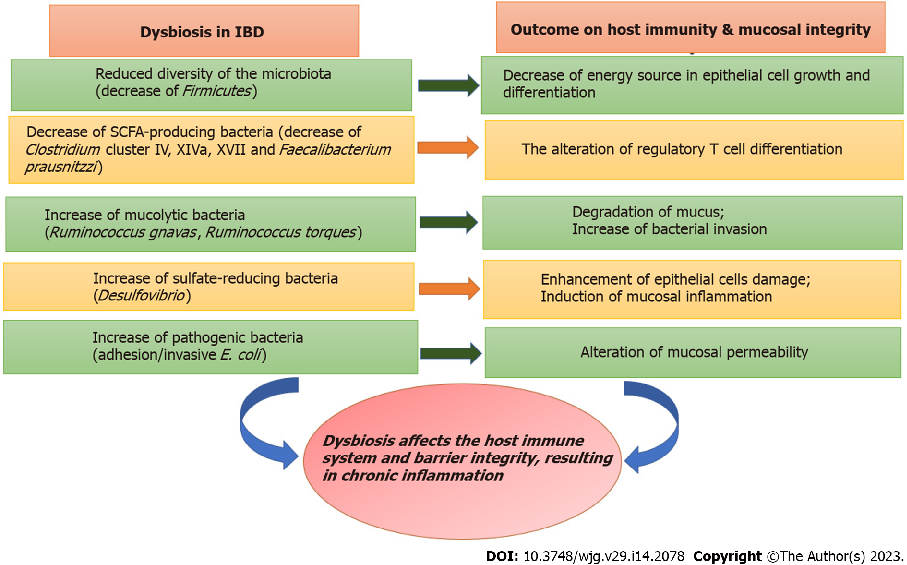
Inflammatory bowel disease pathogenesis involves interplay between genetic susceptibility, environmental factors, immune dysregulation, and gut microbiota alterations. Prebiotics, probiotics, and synbiotics target the microbial component of this multifactorial pathway.
Role of prebiotics, probiotics, and synbiotics in management of inflammatory bowel disease: …
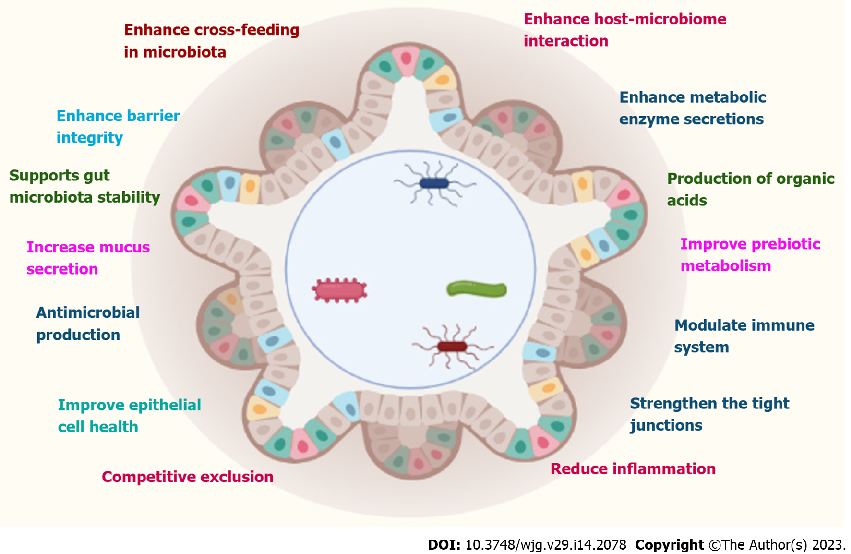
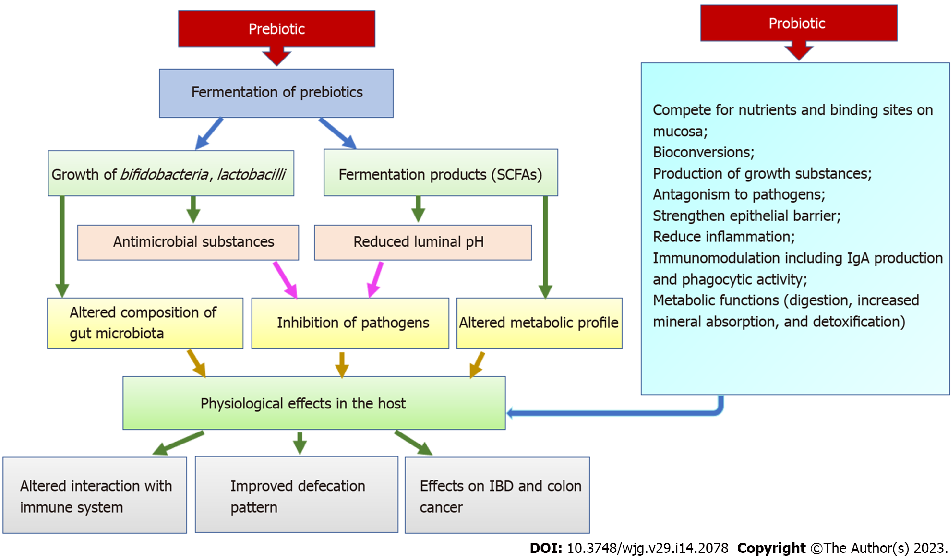
Prebiotics serve as selective substrates for beneficial gut bacteria, promoting the growth of health-associated species such as Bifidobacterium and Lactobacillus. Common prebiotics include inulin, fructooligosaccharides, and galactooligosaccharides.
Role of prebiotics, probiotics, and synbiotics in management of inflammatory bowel disease: …
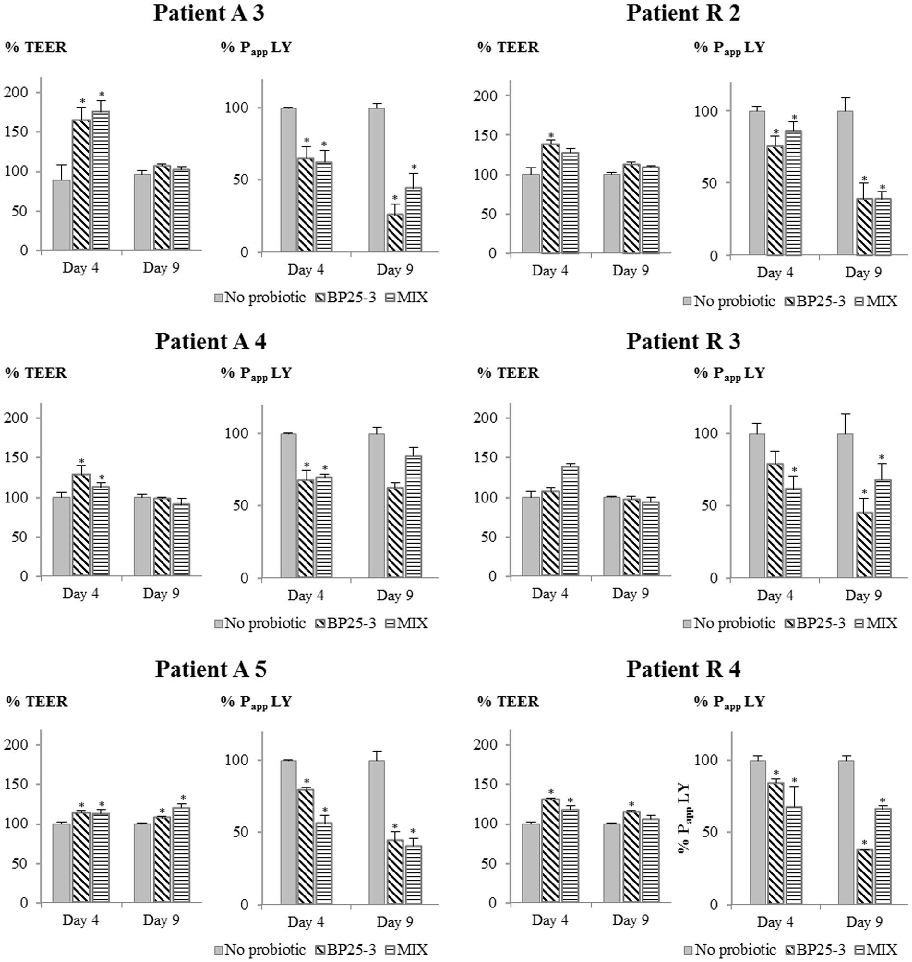
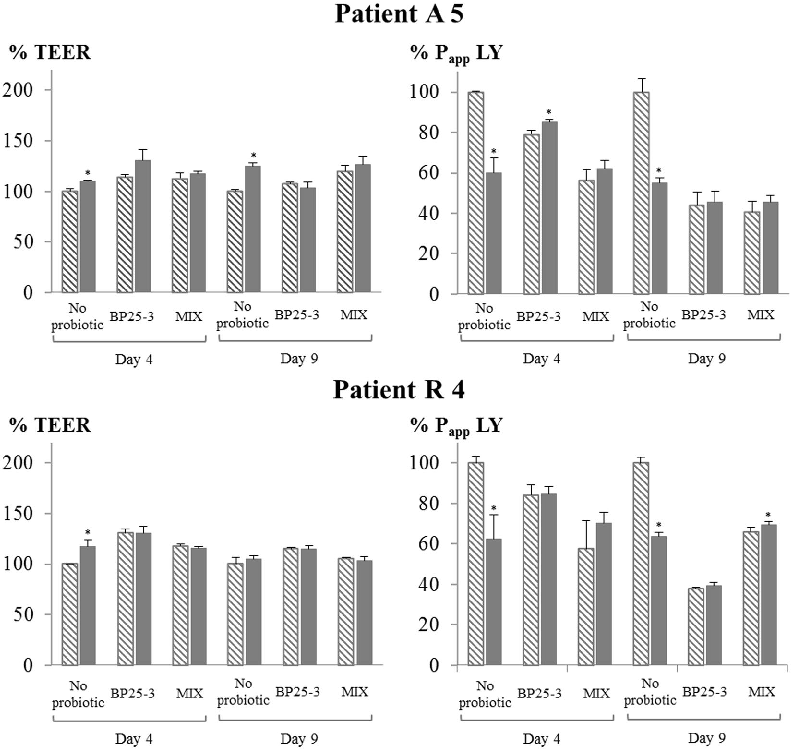
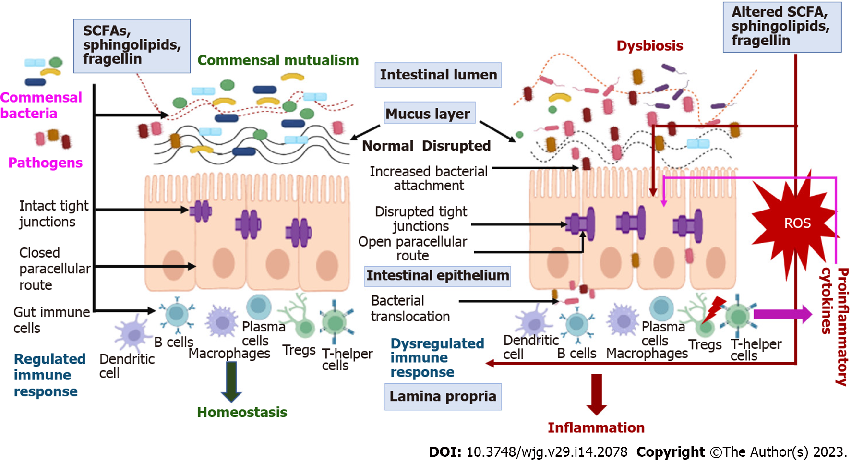
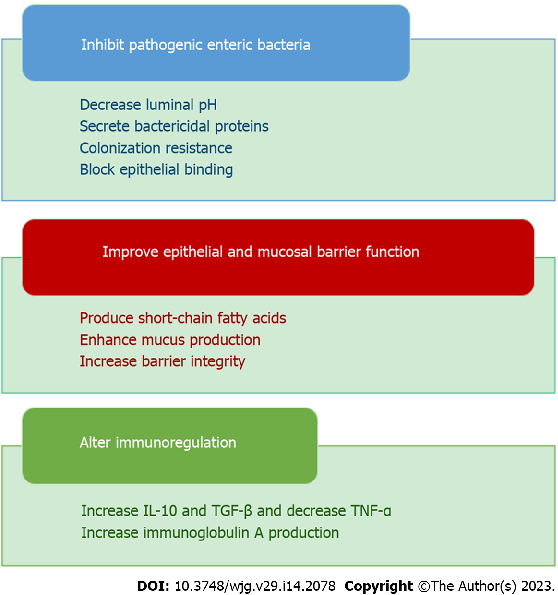
Probiotic mechanisms of action in IBD include strengthening the intestinal epithelial barrier, competing with pathogenic bacteria for adhesion sites, and modulating both innate and adaptive immune responses.
Role of prebiotics, probiotics, and synbiotics in management of inflammatory bowel disease: …
Synbiotics combine probiotics with prebiotics to achieve synergistic effects on gut health. The prebiotic component selectively nourishes the co-administered probiotic strain, potentially enhancing its colonization and metabolic activity.
Role of prebiotics, probiotics, and synbiotics in management of inflammatory bowel disease: …
Clinical evidence for probiotic efficacy in ulcerative colitis is stronger than for Crohn's disease, with certain multi-strain formulations showing benefit in maintaining remission. Strain-specific effects are critical, as not all probiotics demonstrate equivalent therapeutic potential.
Role of prebiotics, probiotics, and synbiotics in management of inflammatory bowel disease: …
Gut microbiota composition in IBD patients is characterized by reduced diversity, decreased Firmicutes abundance, and increased representation of potentially pathogenic Proteobacteria. Probiotic interventions aim to partially normalize these patterns.
Role of prebiotics, probiotics, and synbiotics in management of inflammatory bowel disease: …
Pagina 1 di 20