FODMAP Fingerprinting of Bakery Products and Sourdoughs: Quantitative Assessment and Content Reduction through Fermentation.
Study Design
- Jenis Studi
- Other
- Populasi
- digestive disorders and with disease
- Intervensi
- FODMAP Fingerprinting of Bakery Products and Sourdoughs: Quantitative Assessment and Content Reduction through Fermentation. 28.92 g/kg
- Pembanding
- None
- Luaran Utama
- the effectiveness of sourdough fermentation for FODMAP reduction
- Arah Efek
- Positive
- Risiko Bias
- Unclear
Abstract
Fermentable oligo-, di-, and monosaccharides and polyols (FODMAPs) are associated with digestive disorders and with diseases such as irritable bowel syndrome. In this study, we determined the FODMAP contents of bread, bakery products, and flour and assessed the effectiveness of sourdough fermentation for FODMAP reduction. The fermentation products were analyzed to determine the DP 2-7 and DP >7 fructooligosaccharide (FOS) content of rye and wheat sourdoughs. FOSs were reduced by Acetobacter cerevisiae, Acetobacter okinawensis, Fructilactobacillus sanfranciscensis, and Leuconostoc citreum to levels below those in rye (-81%; -97%) and wheat (-90%; -76%) flours. The fermentation temperature influenced the sourdough acetic acid to lactic acid ratios (4:1 at 4 °C; 1:1 at 10 °C). The rye sourdough contained high levels of beneficial arabinose (28.92 g/kg) and mannitol (20.82 g/kg). Our study contributes in-depth knowledge of low-temperature sourdough fermentation in terms of effective FODMAP reduction and concurrent production of desirable fermentation byproducts.
TL;DR
In-depth knowledge of low-temperature sourdough fermentation in terms of effective FODMAP reduction and concurrent production of desirable fermentation byproducts is contributed.
Full Text
foods
Article
FODMAP Fingerprinting of Bakery Products and Sourdoughs: Quantitative Assessment and Content Reduction through Fermentation
Johannes Pitsch 1,2,† , Georg Sandner 2,† , Jakob Huemer 1, Maximilian Huemer 1, Stefan Huemer 3 and Julian Weghuber 1,2,*
Citation: Pitsch, J.; Sandner, G.; Huemer, J.; Huemer, M.; Huemer, S.; Weghuber, J. FODMAP Fingerprinting of Bakery Products and Sourdoughs: Quantitative Assessment and Content Reduction through Fermentation. Foods 2021, 10,
894. https://doi.org/10.3390/ foods10040894
Academic Editor: Adamantini Paraskevopoulou
- 1 FFoQSI Austrian Competence Center for Feed and Food Quality, Safety and Innovation, Stelzhamerstrasse 23, 4600 Wels, Austria; [email protected] (J.P.); [email protected] (J.H.); [email protected] (M.H.)
- 2 Center of Excellence Food Technology and Nutrition, University of Applied Sciences Upper Austria, Stelzhamerstrasse 23, 4600 Wels, Austria; [email protected]
- 3 Fischer Brot GmbH, Nebingerstraße 5, 4020 Linz, Austria; s.huemer@fischer-brot.at
* Correspondence: [email protected]; Tel.: +43-0508-044-4403 † These authors contributed equally.
Abstract: Fermentable oligo-, di-, and monosaccharides and polyols (FODMAPs) are associated with digestive disorders and with diseases such as irritable bowel syndrome. In this study, we determined the FODMAP contents of bread, bakery products, and flour and assessed the effectiveness of sourdough fermentation for FODMAP reduction. The fermentation products were analyzed to determine the DP 2–7 and DP >7 fructooligosaccharide (FOS) content of rye and wheat sourdoughs. FOSs were reduced by Acetobacter cerevisiae, Acetobacter okinawensis, Fructilactobacillus sanfranciscensis, and Leuconostoc citreum to levels below those in rye (−81%; −97%) and wheat (−90%; −76%) flours. The fermentation temperature influenced the sourdough acetic acid to lactic acid ratios (4:1 at 4 ◦C; 1:1 at 10 ◦C). The rye sourdough contained high levels of beneficial arabinose (28.92 g/kg) and mannitol (20.82 g/kg). Our study contributes in-depth knowledge of low-temperature sourdough fermentation in terms of effective FODMAP reduction and concurrent production of desirable fermentation byproducts.
Keywords: FODMAPs; fructooligosaccharides; charged aerosol detection; arabinose
Received: 14 March 2021 Accepted: 15 April 2021 Published: 19 April 2021
Publisher’s Note: MDPI stays neutral with regard to jurisdictional claims in published maps and institutional affiliations.
Copyright: © 2021 by the authors. Licensee MDPI, Basel, Switzerland. This article is an open access article distributed under the terms and conditions of the Creative Commons Attribution (CC BY) license (https:// creativecommons.org/licenses/by/ 4.0/).
1. Introduction
- 1.1. Definition of FODMAPs
- 1.2. FODMAP-Related Diseases
FODMAPs have been determined to play a major role in gastrointestinal (GI) disorders because they are not absorbed properly in the gut. It is generally estimated that approximately 6–10% of the overall population is affected by functional bowel disorders; in the Western world, these disorders affect up to 20% of the population [3]. The pathophysiology of irritable bowel syndrome (IBS) is multifactorial, including altered brain–gut signaling, carbohydrate malabsorption, gut dysbiosis, immune dysregulation, and visceral hypersensitivity [4]. The FODMAP mode of action is connected to osmotic activity, forcing water into the GI tract. Furthermore, the sugar molecules are fermented by intestinal bacteria,
Foods 2021, 10, 894. https://doi.org/10.3390/foods10040894 https://www.mdpi.com/journal/foods
which increase hydrogen, methane, and carbon dioxide production in the GI tract. Thus, the elevated luminal distension leads to symptoms such as abdominal pain, bloating, and flatulence [5]. In addition, food intake affects the intestinal microbiota, which is generally believed to play an important role in overall health [6].
- 1.3. Low-FODMAP Diets and Bakery Products
- 1.4. Analysis of FODMAPs
- 1.5. Contribution Beyond the State-of-Art
Recently, many papers successfully demonstrated the use of different bacterial strains for FODMAP reduction. Pure cultures in specialized fermentation media were used at
optimal growing conditions (≥25 ◦C) to prove the capability of fructophilic lactic acid bacteria and Lactobacilli to degrade the oligo- and polymers to a significant extent [20,21]. Nonetheless, temperatures ≤ 10 ◦C are favorable in continuous production of sourdough
- as mold growth is promoted at common sourdough fermentation temperatures [22]. Additionally, the use of pure organisms is usually impossible for most bakeries and recreational bakers who mostly rely on their own continuously growing cultures, which are nourished with flours used in latter production, rather than on specialized growing media. Literature still lacks information regarding the relation between source material and continuously grown sourdough at temperatures ≤ 10 ◦C in terms of sourdough microbiome, fermentation byproducts, and FODMAP reduction. To the best of our knowledge, the formation of arabinose as a favorable fermentation byproduct has not been documented to date and should be more closely investigated.
- at 1000 rpm in a thermoshaker. After centrifugation at 17,000 × g at 25 ◦C for 5 min, 100 µL supernatant was transferred into a fresh centrifugation tube and vortexed after adding 450 µL acetonitrile and 450 µL deionized water. The precipitates were removed by repeated centrifugation under the abovementioned conditions. Approximately 850 µL supernatant was transferred into a screw-cap vial for HPLC measurement. The sourdough samples that were analyzed for their organic acid content were transferred into centrifugation tubes and centrifuged. The supernatant (100 µL) was transferred into a fresh centrifugation tube, followed by the addition of 500 µL acetonitrile and 400 µL deionized water.
FOSs and inulin were purified by fractionated collection to obtain FOS containing a sucrose unit (GFn) and pure fructose FOS (Fn) fractions to be used as standards in the subsequent analyses. The fractions were collected in centrifugation tubes, weighed, and analyzed for purity by HPLC-CAD after solvent evaporation at 60 ◦C in a SpeedVac. Hydrolysis was performed in a thermoshaker at 1150 rpm at 80 ◦C for 3 hours using fructanase enzymes to determine the fructose and glucose contents of each fraction.
For the analysis of the FOS content, the samples were extracted with water and centrifuged. The supernatant was utilized for additional sample pretreatment. To ensure that the relevant FOS content could be analyzed with this method, the supernatant was removed, and the residue was washed twice and subjected to enzymatic hydrolysis again. However, no DP 2–7 FOS or fructose were measured in the sample residue.
The sourdough samples were incubated at 4 ◦C, 10 ◦C, 20 ◦C, and 30 ◦C in a thermal incubator (Memmert IN260, Schwabach, Germany). Water was evaporated from the collected oligomer fractions with an Eppendorf 5301 concentrator (Eppendorf AG, Hamburg, Germany) attached to a KNF N840 Laboport (KNF DAC GmbH, Hamburg, Germany) oil-less vacuum pump. Equipment used for sourdough mixing and back-slopping was autoclaved before use.
- 2.3. Enzymatic Tests
- 2.4. Instrumentation
LC-MS-grade water (<0.055 µS/cm) from a Sartorius ultrapure water purification system (Sartorius, Göttingen, Germany) was used for sample preparation. Extractions were performed using a Thermal Shake lite (VWR, Vienna, Austria) thermoshaker. Dry matter measurements were performed using an MA 35 moisture analyzer (Sartorius, Göttingen, Germany).
FOS, fructose, glucose, maltose, mannitol, and sucrose analysis was performed on a Vanquish Flex UHPLC system (Thermo Fisher Scientific, Waltham, MA, USA). The system was equipped with a solvent degasser, binary pump, autosampler, and thermostatic column compartment and coupled to an Ultimate 3000 DAD-3000 DAD, followed by a Vanquish charged aerosol detector (Thermo Fisher Scientific, MA, USA). The compressed air gas flow rate was automatically regulated and monitored by the CAD device. The data collection rate was set to 2.0 Hz with a filter constant of 3.6 s. The power function for response and signal correction was set to 1.0. The evaporation tube temperature was maintained at 35 ◦C. For the inverse gradient conditions, a Thermo UltiMate 3000 HPG 3400 binary pump was connected via a viper capillary (50 µm × 950 mm) with a T-piece to the charged aerosol detector for backpressure consistency. The void volume differences between the analytical and inverse gradient flow paths were determined with a RefractoMax520 RI-Detector (ERC GmbH, Riemerling, Germany).
Chromatographic separation was achieved for carbohydrates and polymers with the Vanquish Flex system using two serially connected Waters Acquity UPLC BEH amide
columns (130 Å, 1.7 µm, 2.1 mm × 150 mm) maintained at 35 ◦C. The autosampler was kept at 25 ◦C. A guard column (Acquity UPLC BEH Amide VanGuard precolumn, Milford, MA, USA) was used to protect the column from contamination by particles. Mobile phase A was 90% acetonitrile, and mobile phase B was 50% acetonitrile. Both mobile phases contained 10 mM NH4Ac adjusted to pH 9.00 with NH4OH (25%, NH3 basis). All buffer components were filtered through a 0.2 µm membrane filter. The gradient program used is shown in (Table 1).
Table 1. Analytical and inverse gradient program.
Analytical Gradient (Vanquish Pump) Inverse Gradient (HPG 3400) %A %B %A %B
Time (min)
Flow Rate (mL/min)
−10.000 0.23 99.0 1.0 1.0 99.0 0.000 0.23 99.0 1.0 1.0 99.0 5.000 0.23 99.0 1.0 1.0 99.0
35.000 0.23 1.0 99.0 99.0 1.0 45.000 0.23 1.0 99.0 99.0 1.0
The autosampler needle was washed with 100 µL (20 µL/s) deionized water before and after each injection to prevent sample carryover between runs. The injection volume was 5 µL. The level of acetonitrile (70%) in the mobile phase reaching the charged aerosol detector was kept constant by setting the delay for the inverse gradient pump to 2.77 min. The flow rate was kept constant for both gradient pumps.
Organic acid, arabinose, fructose, glucose, and mannitol analysis was performed on an UltiMate 3000 UHPLC system (Thermo Fisher Scientific, Waltham, MA, USA) equipped with a solvent degasser, quaternary pump, autosampler, thermostatic column compartment, and RefractoMax520 RI detector. The data collection rate was set to 5.0 Hz at a rise time of 0.25 s. The temperature of the detector flow cell was kept at 35 ◦C. Data processing was carried out with Chromeleon 7.2.10 software (Thermo Fisher Scientific, MA, USA).
Chromatographic separation was achieved using a Bio-Rad Aminex HPX-87H column (9 µm, 7.8 mm × 300 mm) maintained at 30 ◦C. The autosampler was kept at 25 ◦C. A guard column (Micro-Guard Cation H Refill Cartridge, 30 mm × 4.6 mm, Hercules, CA, USA) was used to protect the column from particles. For isocratic separation at 0.6 ml/min, LC-MS-grade water (<0.055 µS/cm) was used. The mobile phase contained 0.010 mol/L H2SO4. The autosampler needle was washed with 100 µL (20 µL/s) mobile phase H2SO4 before and after each injection to prevent sample carryover between runs. The injection volume was 25 µL.
- 2.5. Sourdough Fermentation
- 2.6. Next-Generation Sequencing (NGS)
Next-generation sequencing was performed by Loop Genomics (San Jose, CA, USA). Loop Genomics maintains a cloud-based platform for processing raw short reads prepared with a LoopSeq kit into assembled synthetic long contigs. Within this pipeline, reads are
trimmed to remove adapter sequences before they are demultiplexed based on their loop sample index, which groups reads by the sample from which they originated.
With enough short reads to cover the full length of a 16S molecule, it is possible to reassemble the original long sequence by linking the reads. Short reads whose sequences partially overlap can be linked through that shared sequence and then be arranged in the correct order to build the original 16S molecule sequence.
- 2.7. Statistics
Statistical analysis was performed with Chromeleon 7.2.10 (Thermo Fisher Scientific, Waltham, MA, USA) and Excel 365 (Microsoft, Redmond, WA, USA) using linear regression, intra- and interday repeatability, the unpaired Student’s t-test, and multivariable regression analysis. In the experiments, the mean is based on n = 9 individual samples. In this study, the results are presented as the means ± SDs and significance levels of p < 0.05 (c), p < 0.01 (b), and p < 0.0001 (a). Figures were prepared using CorelDraw 2019 (Corel Corporation, Ottawa, Ontario, Canada).
- 3. Results 3.1. FOS and Fructose Contents of Bread and Bakery Products
Samples with low additive content (<1%) were chosen for these analyses. Crust-bread, wheat-rye-bread, white bread, and hard rolls contained rapeseed oil and yoghurt, which did not affect the FODMAP content. The fructose and DP 2–7 FOS content was determined in the supernatant after extraction and centrifugation in water by direct HPLC-DAD-IGCAD detection. The results are shown in (Tables 2 and 3) and are provided in order of increasing DP 2–7 FOS content.
Table 2. Bakery products under study: types of sourdough used for dough proofing, flours used in production, FOS, and fructose content.
Sourdough Flour FOS DP 2–7 FOS DP >7 Fructose Wheat Rye Wheat Rye g/kg
Product
hard roll - - W550 - 5.09 ± 0.25 3.19 ± 0.34 1.91 ± 0.05 light bread - - W550 - 5.50 ± 0.36 4.16 ± 0.18 1.34 ± 0.04
white bread x - W550 - 7.66 ± 0.28 5.08 ± 0.50 2.58 ± 0.10 wheat-rye bread x x W1600 R960 16.90 ± 1.36 13.12 ± 0.69 3.79 ± 0.08
French bread - - W550 - 18.41 ± 1.54 16.87 ± 1.25 1.54 ± 0.05 farm-baked bread - x W700;W1600 R960 20.04 ± 1.80 16.21 ± 0.71 3.82 ± 0.02
crusty bread - x W1600 R960 22.33 ± 0.87 16.77 ± 1.80 5.56 ± 0.08 cottage bread x x W700; W1600 R960 27.95 ± 1.28 20.13 ± 1.32 7.82 ± 0.03 Bio-Kornspitz - - W550 mixed 27.96 ± 0.45 22.07 ± 0.86 5.89 ± 0.11
farmhouse bread - x W1600 R960 28.08 ± 1.48 24.30 ± 1.20 3.78 ± 0.09
Bakery products containing higher levels of wheat flour (hard rolls, light bread, white bread) showed the lowest FOS content (DP 2–7, ≤7.66 g/kg; DP > 7, ≤5.08 g/kg) of all tested samples. Lower FOS content for both DP 2–7 and DP > 7 were observed in the mixed wheat (≤40%) and rye (<30%) bakery products (crusty bread, farm-baked bread, French bread and wheat-rye bread) than in the cottage bread and farmhouse bread, which had a high proportion of rye flour (>50%). The Bio-Kornspitz sample, which consisted of mainly wheat (>45%) and less rye (<30%) flour, constituted an exception, as it exhibited a high FOS content (DP 2–7, 27.96 ± 0.45 g/kg; DP > 7; 22.07 ± 0.86 g/kg). Because the FOS and fructose contents of the bakery products varied, the flours used in those bakery products were analyzed.
Table 3. Flours under study: milling degree, FOS, and fructose content.
Flour FOS DP 2–7 FOS DP >7 Fructose Vendor Type g/kg Pfahndl Eco flour 1.59 ± 0.03 7.78 ± 1.36 0.38 ± 0.03
Bio Mühle W700 1.67 ± 0.60 8.64 ± 0.38 0.68 ± 0.15
Arnreiter spelt 1.68 ± 0.13 6.07 ± 0.20 0.30 ± 0.02 Wiesbauer W700 1.70 ± 0.13 7.91 ± 0.27 0.35 ± 0.05
Polsterer W550 1.71 ± 0.25 7.77 ± 0.16 0.25 ± 0.02 Haberfellner W550 1.76 ± 0.07 7.68 ± 0.25 0.27 ± 0.03 Haberfellner R500 1.90 ± 0.27 19.28 ± 0.99 0.81 ± 0.29 Haberfellner W500 1.91 ± 0.13 7.75 ± 0.08 0.30 ± 0.03
Klinger W700 2.39 ± 0.53 8.09 ± 0.12 0.48 ± 0.03 Good Mills W700 2.67 ± 0.28 8.66 0.44 0.34 ± 0.06 Bio Mühle spelt 2.68 ± 0.37 8.92 ± 0.17 0.59 ± 0.05
Haberfellner W1600 2.77 ± 0.49 12.72 ± 1.17 1.24 ± 0.11 Klinger W1600 3.12 ± 0.21 14.85 ± 0.10 1.26 ± 0.09 Klinger R960 3.37 ± 0.31 25.20 ± 1.32 2.42 ± 0.28
Premium-Bio Mühle R960 3.39 ± 0.66 23.62 ± 0.83 1.94 ± 0.11 Haberfellner wheat whole grain 3.82 ± 1.28 13.05 ± 0.69 2.42 ± 0.20 Haberfellner R960 3.93 ±0.33 28.05 ±0.48 2.41 ± 0.25
Arnreiter spelt whole grain 3.94 ± 0.19 11.34 ±0.29 1.51 ± 0.13 Haberfellner rye whole grain 4.28 ±0.24 29.34 ± 1.11 2.52 ± 0.28 Haberfellner R2500 5.44 ± 2.12 40.06 ± 1.63 4.86 ± 0.92
- 3.2. FOS and Fructose Contents of Rye, Spelt and Wheat Flour
- 4.5-fold) flour. The fructose (±9.10%; ±12.07%) and DP 2–7 (±5.73%; ±8.90%) and DP >7 (±0.59%;
±8.77%) FOS content of the W550 and R960 flours did not appear to vary by manufacturer. The deviations in the fructose (0.46 ± 0.16 g/kg) and DP 2–7 FOS (2.95 ± 0.25 g/kg) and DP >7 FOS (13.78 ± 1.51 g/kg) contents were more pronounced in the W700 flour than in the other flours but remained within a range that is typical for natural products. As their FOS content had been determined and did not appear to be dependent on the manufacturer, W700 and R960 flour, which came from different manufacturers, were selected for the sourdough fermentation trials.
3.3. FOS Content of Rye and Wheat Sourdough
Rye-based cultures fermented at 20 ◦C developed an unpleasant smell after 30 days; after 35 days, the fermentation process had to be stopped due to excessive mold growth. Rye fermentation at 30 ◦C was aborted after 7 days, as mold growth and olfactory issues became evident during that period. Results could not be obtained for wheat-based sourdough fermented at 20 ◦C and 30 ◦C, as both trials showed excessive mold growth within the first
after 35 days, the fermentation process had to be stopped due to excessive mold growth. Rye fermentation at 30 °C was aborted after 7 days, as mold growth and olfactory issues
dough fermented at 20 °C and 30 °C, as both trials showed excessive mold growth within the first week of fermentation. For both rye and wheat sourdoughs, temperatures of 20 °C and 30 °C proved to be unsuitable for back-slopping once a week.
week of fermentation. For both rye and wheat sourdoughs, temperatures of 20 ◦C and 30 ◦C proved to be unsuitable for back-slopping once a week.
Mold growth was not observed in the rye- or wheat-based cultures fermented at 4 ◦C or 10 ◦C, and no olfactory abnormalities from these cultures were noted. In the course of the one-week fermentation period, the samples became more fluid, and a perceivably acidic smell was generated. Each of the biological replicates was analyzed for its fructose and FOS content in triplicate. The results, including the most relevant data points, are depicted in (Figure 1).
Mold growth was not observed in the rye- or wheat-based cultures fermented at 4 °C or 10 °C, and no olfactory abnormalities from these cultures were noted. In the course of the one-week fermentation period, the samples became more fluid, and a perceivably acidic smell was generated. Each of the biological replicates was analyzed for its fructose and FOS content in triplicate. The results, including the most relevant data points, are depicted in (Figure 1).
- Figure 1. Fructose, DP 2–7 FOS, and DP >7 FOS content of sourdough (35 g water; 35 g flour). p < 0.05 (c), p < 0.01 (b), p < 0.0001 (a) and p > 0.05 (ns) indicate significant differences from the control (W700 or R960). (A) Wheat sourdough; 4 ◦C; W700. (B) Wheat sourdough; 10 ◦C; W700. (C) Rye sourdough; 4 ◦C; R960. (D) Rye sourdough; 10 ◦C; R960.
The results for the wheat sourdough replicates fermented at 4 ◦C and 10 ◦C are depicted in Figures 1A and 1B, respectively. The fructose content in the wheat sourdough was equal to that in the rye sourdough throughout the fermentation trials, although the lower initial fructose content in the flour types used had to be considered in the comparison. However, at 10 ◦C, the content of DP >7 FOSs was significantly (p < 0.0001) decreased over the course of fermentation, whereas the level of short chain FOSs remained constant at <1 g/kg throughout the fermentation process. After an increase between day 28 and day 42, the DP 2–7 FOS content was detectable at similar concentrations in sourdough fermented at 4 ◦C.
, x. https://doi.org/10.3390/xxxxx www.mdpi.com/journal/foods
After 105 days of fermentation, the microbiome in the wheat sourdough was capable of significant (p < 0.0001) reductions in the DP 2–7 FOS content, and the DP >7 FOS content compared with the initial content in the W700 flour at 4 ◦C (−60%, −99%) and 10 ◦C (−66%, −79%), respectively.
Rye sourdough samples fermented at 4 ◦C (Figure 1C) showed a decrease in DP 2–7 FOS content between day 42 (2.71 ± 0.82 g/kg) and day 84 (0.28 ± 0.07 g/kg). The content of long-chain DP >7 FOSs increased from day 28 (1.04 ± 0.11 g/kg) to day 84 (4.90 ± 0.14 g/kg) and then remained at the same level until day 105 (5.13 ± 0.14 g/kg). Additionally, changes in FOS content decreased noticeably throughout the whole fermentation period in the three independent cultures. Concerning fructose content, a significant (p < 0.0001) reduction compared with that in R960 flour (from 3.37 ± 0.31 g/kg to
- 0.57 ± 0.32 g/kg) was observed after 28 days of fermentation. The rye flour fermentation results at 10 ◦C (Figure 1D) showed an increase in DP >7
- 1.31 ± 0.02 g/kg to 0.67 ± 0.38 g/kg), and then stability until the end of the fermentation trials. A significant (p < 0.0001) decrease in DP 2–7 FOS content was observed after 42 days (−91.74%), but the decrease leveled off for the remaining fermentation period. The fructose content in the fermented rye sourdough at 10 ◦C was comparable with that in the rye sourdough fermented at 4 ◦C.
The early termination of the rye sourdough trials at 20 ◦C after 35 days prevented us from making reliable statements regarding the fructose and FOS content in these trials. Large standard deviations in the DP >7 FOS content were detected after 7 days. However, the deviations then began to stabilize, and the DP >7 FOS content had increased in the samples that were analyzed after 21 and 35 days. The short-chain FOS content decreased significantly from day 21 (2.25 ± 0.39 g/kg) to day 35 (0.22 ± 0.28 g/kg) and was comparable to that in rye sourdough samples obtained at fermentation temperatures of 4 ◦C and 10 ◦C after 105 days, respectively. This trend also applied to the fructose content.
Compared with those in R960 flour, the fructose, DP 2–7 FOS, and DP >7 FOS content was significantly (p < 0.00001) decreased by the microbiome in the rye sourdough fermented for 105 days at 4 ◦C (−77%, −92%, −80%, respectively) and 10 ◦C (−77%, −89%, −98%).
3.4. Organic Acids Produced by Microorganisms in Rye and Wheat Sourdough
Organic acids are considered to greatly influence the taste and texture of a final bakery product. Therefore, wheat and rye sourdough were fermented at 4 ◦C and 10 ◦C for 105 days and evaluated for their lactate, acetate, and citrate contents during the fermentation process. The standard used for quantitation contained the sodium salt form of the organic acids. As the bond cations in sourdough were not analyzed and sulfuric acid was used in the mobile phase, it must be assumed that all acids were determined as H+ moieties. The standard used for quantitation contained malic acid, succinic acid, and oxalic acid as well, but none of those acids were found in the sourdough.
The values depicted in Figure 2 are the results of the analyses of three biological replicates at each temperature, measured in triplicate with HPLC-RI. The pH values of all analyzed sourdough samples were between 3.1 and 4.0. The microbiome of all sourdoughs under investigation showed increased organic acid production within the first 14 to 28 days. The total acidity after 105 days was markedly higher in rye sourdough fermented at 10 ◦C (Figure 2D; 57.92 g/L) than in rye sourdough fermented at 4 ◦C (Figure 2C; 38.51 g/L) and in wheat sourdough fermented at 4 ◦C (Figure 2A; 25.83 g/L) and 10 ◦C (Figure 2B; 39.39 g/L). Citrate was apparently not metabolized at 10 ◦C after 70 days of fermentation in rye or in wheat sourdough and therefore did not contribute to the total acid content.
The lactic acid to acetic acid ratio is well known for its importance in sourdough due to its sensorial influence on the taste and softness of the resultant bakery products. The ratio in rye and wheat (4:1) sourdough at 4 ◦C was remarkably higher in rye from day 56 to 105 than during other times during fermentation and in wheat (1:1) sourdough at 10 ◦C from day 70 to 105, independent of the absolute acidity of the sourdoughs. The acidity of the sourdoughs as well as the ratios of the three organic acids under evaluation had stabilized by 84 days of fermentation.
fermentation in rye or in wheat sourdough and therefore did not contribute to the total
Figure 2. Acetic acid, citric acid, and lactic acid ratios of sourdough. ( ) Wheat sourdough; 4 °C; W700. (B) Wheat sourdough; 10 °C; W700. (C) Rye sourdough; 4 °C; R960. (D) Rye sourdough; 10 °C; R960.
- Figure 2. Acetic acid, citric acid, and lactic acid ratios of sourdough. (A) Wheat sourdough; 4 ◦C; W700. (B) Wheat sourdough; 10 ◦C; W700. (C) Rye sourdough; 4 ◦C; R960. (D) Rye sourdough; 10 ◦C; R960.
3.5. Fermentable Mono-, Disaccharides, and Polyols in Rye and Wheat Sourdough
The lactic acid to acetic acid ratio is well known for its importance in sourdough due to its sensorial influence on the taste and softness of the resultant bakery products. The ratio in rye and wheat (4:1) sourdough at 4 °C was remarkably higher in rye from day 56 to 105 than during other times during fermentation and in wheat (1:1) sourdough at 10 °C from day 70 to 105, independent of the absolute acidity of the sourdoughs. The acidity of the sourdoughs as well as the ratios of the three organic acids under evaluation had stabilized by 84 days of fermentation.
The contents of the monosaccharides arabinose, glucose, maltose, and mannitol were analyzed throughout the fermentation period. As depicted in (Figure 3A,B), no arabinose was detected in wheat sourdough during the whole fermentation period, whereas maltose did not occur in rye sourdough at 10 ◦C (Figure 3D).
In wheat sourdough, peaks in glucose and maltose content at 4 ◦C and 10 ◦C (Figure 3A,B) were observable after 28 days. The same was true for mannitol at 10 ◦C. At 4 ◦C, mannitol was detectable for the first time on day 42 and remained at a constant level of 4.2 ± 0.6 g/kg thereafter. Wheat sourdough at 10 ◦C showed the lowest total monosaccharide content, 4.15 g/kg, on day 105. A direct comparison of rye sourdough at 4 ◦C and 10 ◦C revealed differences in glucose content: at 10 ◦C, the glucose content fell below the limit of detection, while levels of 44.6 ± 4.4 g/kg were maintained at 4 ◦C. The heavily fluctuating mannitol levels (27.4 ± 20.1 g/kg) in rye sourdough at 10 ◦C between day 0 and 63 levelled out to 26.9 ± 1.7 g/kg between day 84 and 105; in contrast, in rye sourdough at 4 ◦C, the mannitol content remained at 20.8 ± 2.2 g/kg throughout the whole fermentation period.
www.mdpi.com/journal/foods
Foods 2021, 10, x FOR PEER REVIEW 11 of 18
Foods 2021, 10, 894 11 of 18
no arabinose was detected in wheat sourdough during the whole fermentation period,
- Figure 3. Arabinose, glucose, maltose, and mannitol contents of sourdough. (A) Wheat sourdough; 4 ◦C; W700. (B) Wheat sourdough; 10 ◦C; W700. (C) Rye sourdough; 4 ◦C; R960. (D) Rye sourdough; 10 ◦C; R960.
3.6. Analysis of the Microbiome in Rye and Wheat Sourdough
- 3A and 3B) were observable after 28 days. The same was true for mannitol at 10 °C. At 4 °C, mannitol was detectable for the first time on day 42 and remained at a constant level of 4.2 ± 0.6 g/kg thereafter. Wheat sourdough at 10 °C showed the lowest total monosaccharide content, 4.15 g/kg, on day 105. A direct comparison of rye sourdough at 4 °C and 10 °C revealed differences in glucose content: at 10 °C, the glucose content fell below the limit of detection, while levels of 44.6 ± 4.4 g/kg were maintained at 4 °C. The heavily fluctuating mannitol levels (27.4 ± 20.1 g/kg) in rye sourdough at 10 °C between day 0 and 63 levelled out to 26.9 ± 1.7 g/kg between day 84 and 105; in contrast, in rye sourdough at
- 4 °C, the mannitol content remained at 20.8 ± 2.2 g/kg throughout the whole fermentation period.
To identify the microorganisms responsible for the reduction in FOS content and the formation of arabinose and mannitol, NGS was performed. Although the same sourdough cultures were used for fermentation at 4 ◦C and 10 ◦C, the results revealed different microbiomes in the rye and wheat sourdough, as shown in (Figure 4).
An inconsistent microbiome was detected in the wheat sourdough at 4 ◦C (Figure 4A–C). While the wheat starter cultures (Figure 4A) incorporated >40% Saccharomyces cerevisiae, none of those cultures were detected on day 105 in the wheat sourdough at 4 ◦C. Although Lactobacillus sp. (68.3%) and Fructilactobacillus sanfranciscensis (30.8%) made up the majority of organisms on day 28, they were no longer detectable on day 105. At 10 ◦C, the microbiome of wheat sourdough proved to be more consistent than that at 4 ◦C after the substantial growth of Acetobacter okinawensis from day 28 until day 105 (Figure 4D,E). Lactobacillus sp. was present starting on day 0, with an average relative abundance of 13.47 ± 0.44%.
, x. https://doi.org/10.3390/xxxxx www.mdpi.com/journal/foods
Lactobacilli represented the most abundant organisms in the rye sourdough (Figure 4F–J), including Fructilactobacillus sanfranciscensis (>20%) and Lactobacillus sp. (>18%). Additionally, in the rye sourdough at 10 ◦C (Figure 4I,J), Acetobacter cerevisiae (31.4%) multiplied until its abundance was almost equal to that of Fructilactobacillus sanfranciscensis (32.8%) on day 105.
cultures were used for fermentation at 4 °C and 10 °C, the results revealed different mi-
Figure 4. Microbiome of sourdough. Inner circle, genus; outer circle, species. (A) Wheat sourdough starter cultures. (B, C) Wheat sourdough, 4 °C. (D, E) Wheat sourdough, 10 °C. (F) Rye sourdough starter cultures. (G, H) Rye sourdough, 4 °C. (I, J) Rye sourdough, 10 °C.
- Figure 4. Microbiome of sourdough. Inner circle, genus; outer circle, species. (A) Wheat sourdough starter cultures. (B,C) Wheat sourdough, 4 ◦C. (D,E) Wheat sourdough, 10 ◦C. (F) Rye sourdough starter cultures. (G,H) Rye sourdough, 4 ◦C. (I,J) Rye sourdough, 10 ◦C.
4. Discussion
Clinical trials suggest that adverse effects in people suffering from IBS are worsened by the ingestion of dietary FODMAPs. Therefore, the identification and reduction of FODMAPs in staple foods represent an important step toward minimizing unfavorable
www.mdpi.com/journal/foods
effects. Comprehensive studies that connect the available products on the market with the flours used for production as well as propose potential methods of reducing FOS content are currently not available. The published research is limited to single aspects, such as the comparison of wheat and rye bread [24], the reduction of FODMAPs by microorganisms [25], or changes in the FODMAP profile in the malting process [26]. In this study, we demonstrate that long-term leavened sourdough at low temperatures exhibits significantly lower FODMAP levels compared with the original flour, and we identified and quantitated arabinose as a valuable byproduct of sourdough fermentation under these conditions. To our knowledge, no scientific publication quantitated the ratio of organic acids in sourdough fermented at 4 ◦C and 10 ◦C. Furthermore, we clarified the difference between rye and wheat sourdough, while proving a strong dependence of fermentation temperature on the degradation capability of long- and short-chain FOS.
By investigating the relationships between bread, flour, and sourdough, both industrial and recreational bakers can be provided with the necessary information with which to develop bakery products with low FODMAP content.
To reach this goal, an advanced HPLC-DAD-IG-CAD method was developed and combined with a well-established HPLC-RI method to determine the FODMAP contents of bakery products and the flours used in their production. Furthermore, the products and organisms involved in back-slop sourdough fermentation were analyzed for their FODMAP content as well as for their fermentation byproducts.
- 4.1. Bread Consumption and IBS
- 4.2. Link between Raw Materials and FODMAP Reduction through Sourdough
Flour, the main component of all tested bakery products, was confirmed to be the key source of FOS. According to the literature, wheat flour has a similar FOS level to spelt flour, while the content in rye flour is higher [30]. R960 and W700 flours, representing the most common flour types used in Austria, were selected for the subsequent sourdough fermentation trials.
The fermentation process does not require complex equipment, which makes sourdough production easy to handle for both customers and manufacturers. The contents of DP 2–7 as well as DP >7 FOSs were significantly reduced in the rye and wheat sourdoughs at 4 ◦C and 10 ◦C compared with those in the flour used for fermentation. Wheat
sourdough at 4 ◦C and rye sourdough at 10 ◦C showed the lowest overall FOS levels. Rye sourdough fermented at 10 ◦C proved to be most suitable for FOS and fructose degradation; this sourdough exhibited rapid adaptation after 42 days of fermentation, and its samples had the lowest standard deviations of all samples. Therefore, we concluded that this dough was the most stable in this study. In wheat sourdough at 10 ◦C, the hydrolysis of DP >7 FOSs increased during fermentation. The decrease in the long-chain FOS content of rye sourdough at 4 ◦C, along with its low DP 2–7 FOS level, could make this dough appropriate for use in bakery products with increased dietary fiber (inulin) content. Sourdough fermentation is an accepted method of FOS degradation, but this is achieved mostly through fermentation at higher temperatures [31]. No assertions about this process could be made for the high-temperature samples in our study, as we obtained only a single data point regarding fermentation at 30 ◦C. In general, higher fermentation temperatures led to unsatisfactory results from our back-slopping batch fermentation method.
However, it can be concluded that rye and wheat sourdoughs are capable of efficient FOS reduction, while yielding the desirable fermentation byproducts acetic acid, arabinose, citric acid, lactic acid, and maltitol. The recent literature suggests that the value of sourdough in influencing taste via fermentation byproducts is becoming increasingly important [32].
- 4.3. The Role of Fermentation Byproducts The lactic acid to acetic acid ratio was 4:1 in both the rye and wheat sourdoughs at
- 4 ◦C and was 1:1 in the sourdoughs at 10 ◦C. The different ratios at the given temperatures suggest that distinct flavor profiles can be obtained depending on the fermentation temperature. The results suggest that the absolute content of both organic acids in bakery products could be mediated by fermentation time or by the sourdough proportion added. However, the ratio of organic acids in this study remained constant in both rye and wheat after 14 days at 4 ◦C and after 56 and 70 days at 10 ◦C, respectively. If dough proofing is conducted at the temperature used for fermentation, no significant change in those ratios should be expected, since proofing times are generally much shorter than fermentation times. Lactic acid and acetic acid are well known to occur in sourdough [33]. In addition to its positive effects on taste and texture, lactic acid was reported to reduce the acrylamide content of bread [34].
The citric acid content in the rye and wheat sourdoughs was approximately 20% at 4 ◦C. At 10 ◦C, the fermentation of citric acid stopped after day 70 in both sourdough types. No organisms specializing in the production of citric acid were detectable in our fermented sourdough. As an intermediate in the citric acid cycle, citric acid might have been excreted from the bacterial cytosol. The citric acid content of sourdough has not been reported in the literature to the best of our knowledge, and citric acid is not known to have any effects on fermented sourdough bread or bakery products. Considering that citric acid has a higher boiling point than acetic and lactic acid, citric acid should remain in bakery products if common baking temperatures (<250 ◦C) are used. The involatile nature of citric acid could inhibit the Maillard reaction in the bread crust, which is exposed to the highest temperatures. Presumably, this could lead to decreased acrylamide content, as observed with lactic acid.
Arabinose was detected in the rye sourdoughs fermented at 4 ◦C and 10 ◦C at 28.92 ± 10.98 g/kg. The ability to ferment arabinose has been reported in LAB [35]. Due to its inhibition of sucrase, arabinose has been reported to inhibit colitis by modulating the gut microbiota [36]. Colitis is defined as an infection of the large intestine and is related to symptoms that also occur in patients experiencing IBS [37]. Therefore, a high arabinose content in foods can be regarded as beneficial for reducing the inflammation that occurs in this patient group.
Mannitol was detected at higher concentrations (3.81 ± 2.44 g/kg) in rye sourdough than in wheat sourdough. The ability of lactobacilli to convert fructose to mannitol has been reported [11]. Mannitol cannot be metabolized by the human digestive system and
is therefore used as a marker for intestinal permeability [38]. No adverse effects of high mannitol content on IBS symptoms are expected, but positive effects for patients with piriformis syndrome have been reported [38]. Mannitol is used in the food industry as an alternative sweetener to replace sucrose [39], providing a sweeter taste in bakery products [40]. Hence, rye sourdough could be used to alter the sweetness profile of the final bakery product.
The HPLC-RI device used for saccharide and polyol analysis was calibrated for erythritol, lactose, maltitol, sorbitol, sucrose, and xylitol. However, none of those compounds were detected in the sourdoughs.
- 4.4. Sourdough Microbiome
- 5. Conclusions
This study shows the feasibility of an easy-to-perform fermentation technique that can be industrially or domestically applied, as well as its benefits for the nutritional parameters of the sourdough produced. Back-slop-feeding on a daily basis is used in industry mostly due to the higher sourdough amounts required for production. Here, we suggest a method that primarily serves the cultivation of desired organisms rather than the purpose of producing large amounts of sourdough.
As flour was identified as the main source of FOSs, the use of low-FOS flour can reduce the final FOS content in products prior to their further processing. We successfully created linkages between flour, the sourdough microbiome, and fermentation byproducts
to sketch a coherent picture of this process. With the appropriate starter cultures, longterm fermentation without the growth of unwanted microbes is possible. We find that by varying fermentation temperatures and flour compositions, bakeries could grow different sourdough cultures and create blends with specific acid and sweetness profiles. We are convinced that the results of this study will contribute to a deeper understanding of sourdough fermentation and can lead to the development of modified products that provide additional benefits for people experiencing GI disorders, as well as for all other people.
Author Contributions: J.P.: conceptualization, formal analysis, data curation, writing original draft, methodology, investigation, supervision. G.S.: formal analysis, data curation, writing original draft, investigation. J.H.: data curation, investigation. M.H.: data curation, investigation. S.H.: conceptualization, resources. J.W.: writing, reviewing and editing, data curation, project administration, funding acquisition. All authors have read and agreed to the published version of the manuscript.
Funding: This work was created within a research project of the Austrian Competence Centre for Feed and Food Quality, Safety and Innovation (FFoQSI). The COMET-K1 Competence Centre FFoQSI is funded by the Austrian ministries BMVIT, BMDW, and the Austrian provinces Niederoesterreich, Upper Austria, and Vienna within the scope of COMET—Competence Centers for Excellent Technologies. The program COMET is handled by the Austrian Research Promotion Agency FFG.
Institutional Review Board Statement: Not applicable. Informed Consent Statement: Not applicable. Data Availability Statement: The data presented in this study are available on request from the corresponding author. The data are not publicly available due to privacy restrictions.
Conflicts of Interest: The authors declare no conflict of interest. The funders had no role in the design of the study; in the collection, analyses, or interpretation of data; in the writing of the manuscript; or in the decision to publish the results.
Figures
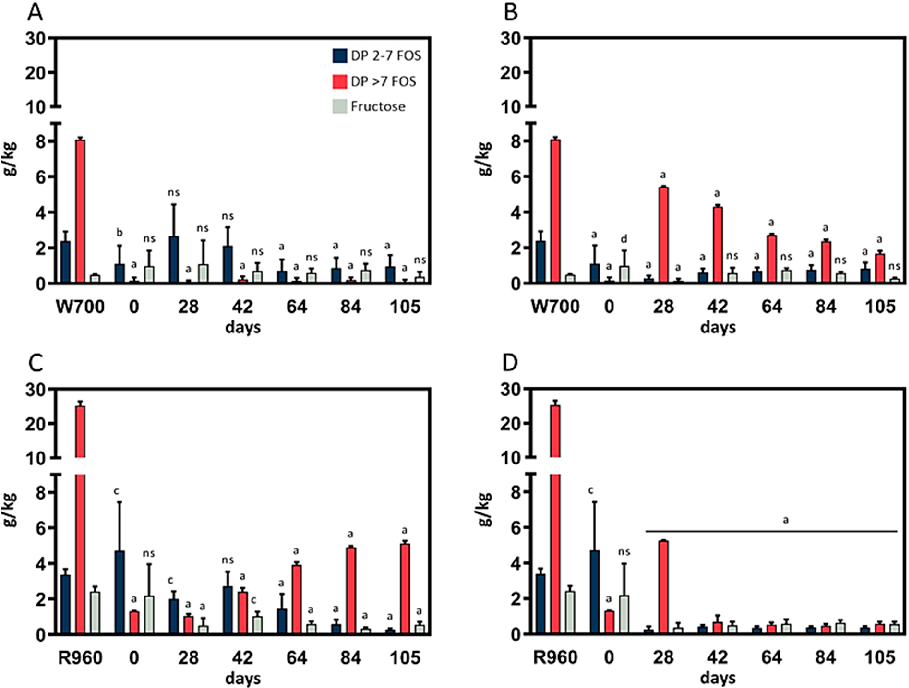
Figure 6
Fructose, DP 2–7 FOS, and DP >7 FOS content of sourdough (35 g water; 35 g flour). p < 0.05 (c), p < 0.01 (b), and p < 0.0001 (a) indicate significant differences from the control.
chart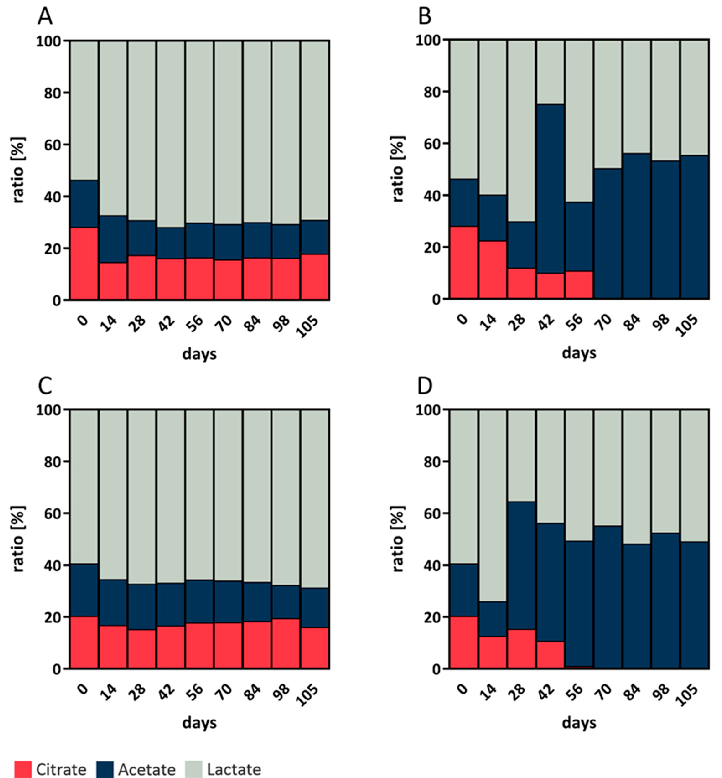
Figure 7
Statistical analysis from research investigating FODMAP Fingerprinting of Bakery Products and Sourdoughs, comparing treatment groups and control conditions.
chart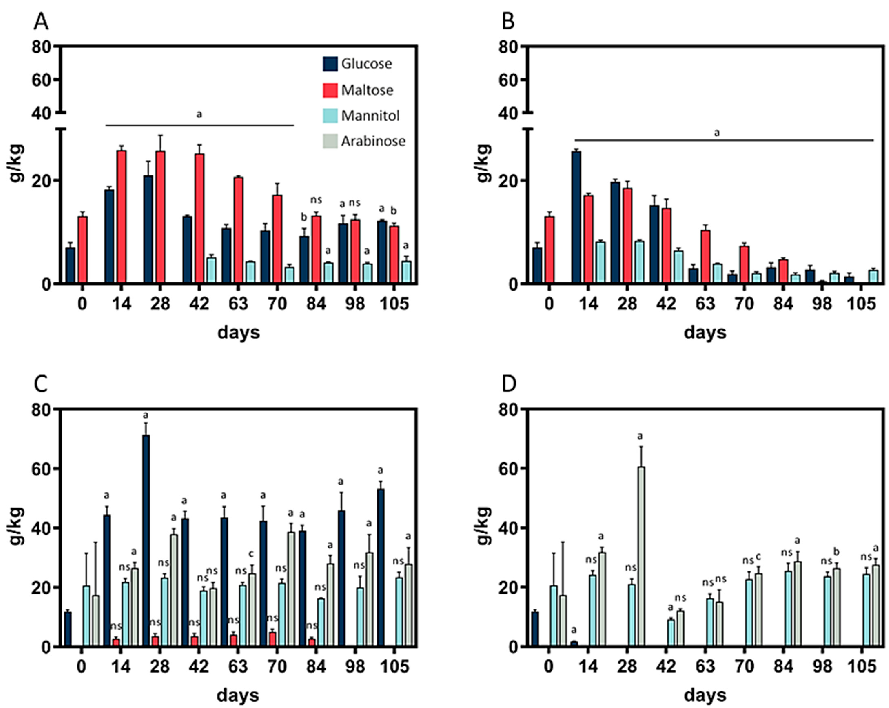
Figure 8
Arabinose, glucose, maltose, and mannitol contents of sourdough. (A) Wheat sourdough; 4 °C; W700.
chart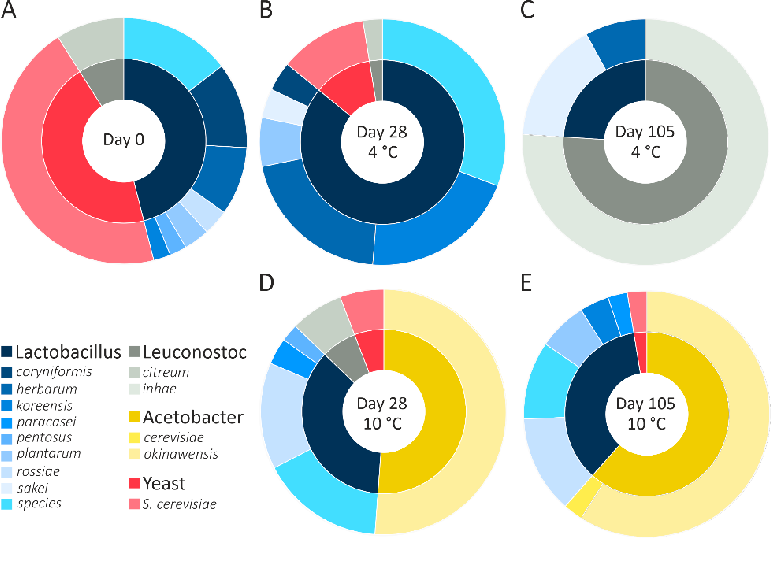
Figure 9
Graphical representation of outcomes in a study of FODMAP Fingerprinting of Bakery Products and Sourdoughs, highlighting trends observed across experimental conditions.
chart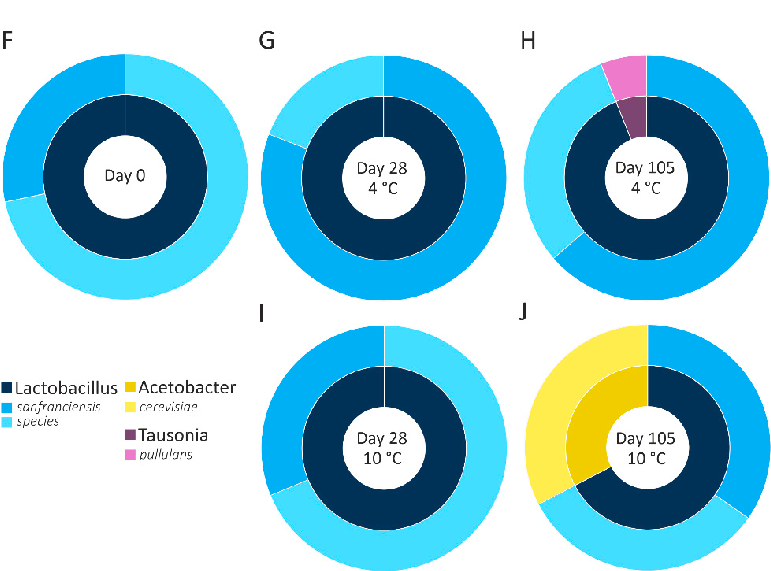
Figure 10
Quantitative data from a study on FODMAP Fingerprinting of Bakery Products and Sourdoughs, presenting measured outcomes relevant to the investigation of fermentable oligo-, di-, and monosaccharides and polyols (FODMAPs) are associated with digestive disorders and with d.
chartUsed In Evidence Reviews
Similar Papers
Alimentary pharmacology & therapeutics · 2006
Review article: prebiotics in the gastrointestinal tract.
The Journal of nutrition · 2012
Fermentable carbohydrate restriction reduces luminal bifidobacteria and gastrointestinal symptoms in patients with irritable bowel syndrome.
Journal of the Academy of Nutrition and Dietetics · 2017
Understanding the Physics of Functional Fibers in the Gastrointestinal Tract: An Evidence-Based Approach to Resolving Enduring Misconceptions about Insoluble and Soluble Fiber.
Journal of physiology and biochemistry · 2009
Dietary fructooligosaccharides and potential benefits on health.
Gastroenterology · 2020
Effects of Low FODMAP Diet on Symptoms, Fecal Microbiome, and Markers of Inflammation in Patients With Quiescent Inflammatory Bowel Disease in a Randomized Trial.
Journal of gastroenterology and hepatology · 2017