Description
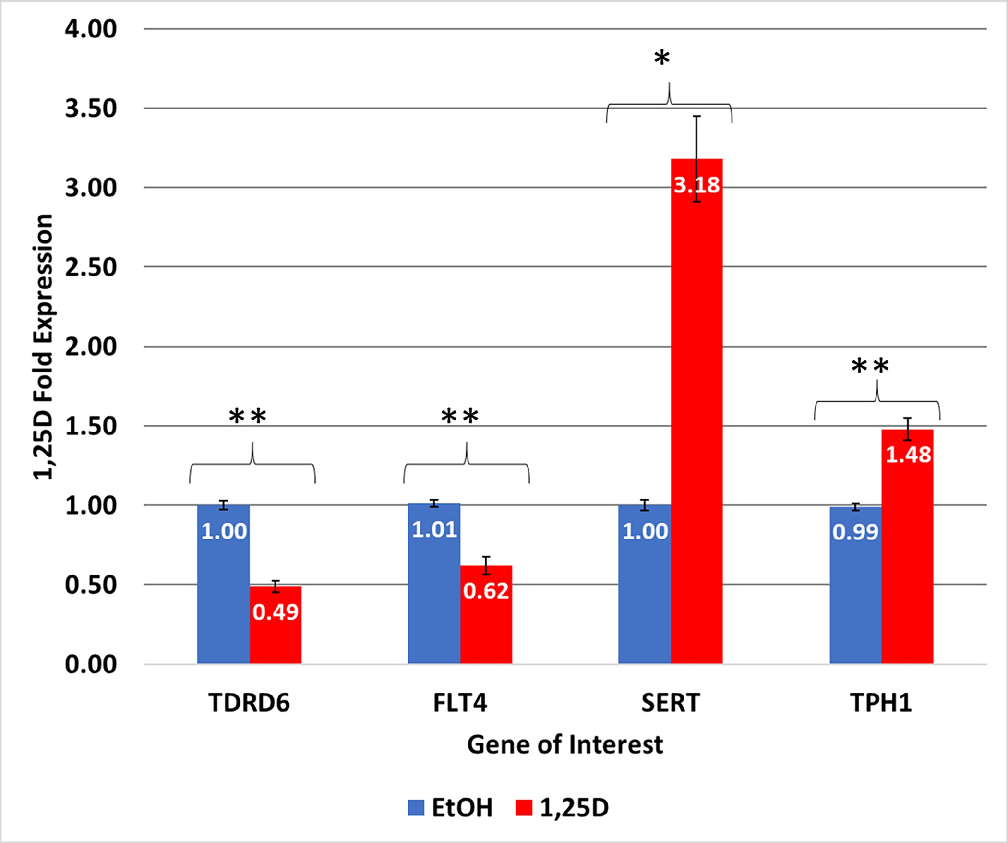
IBS-Associated gene regulation by 1,25D. The mRNA levels of each gene were determined using quantitative real-time polymerase chain reaction (RTqPCR) for a total of three to six replicates.
More Figures from This Paper
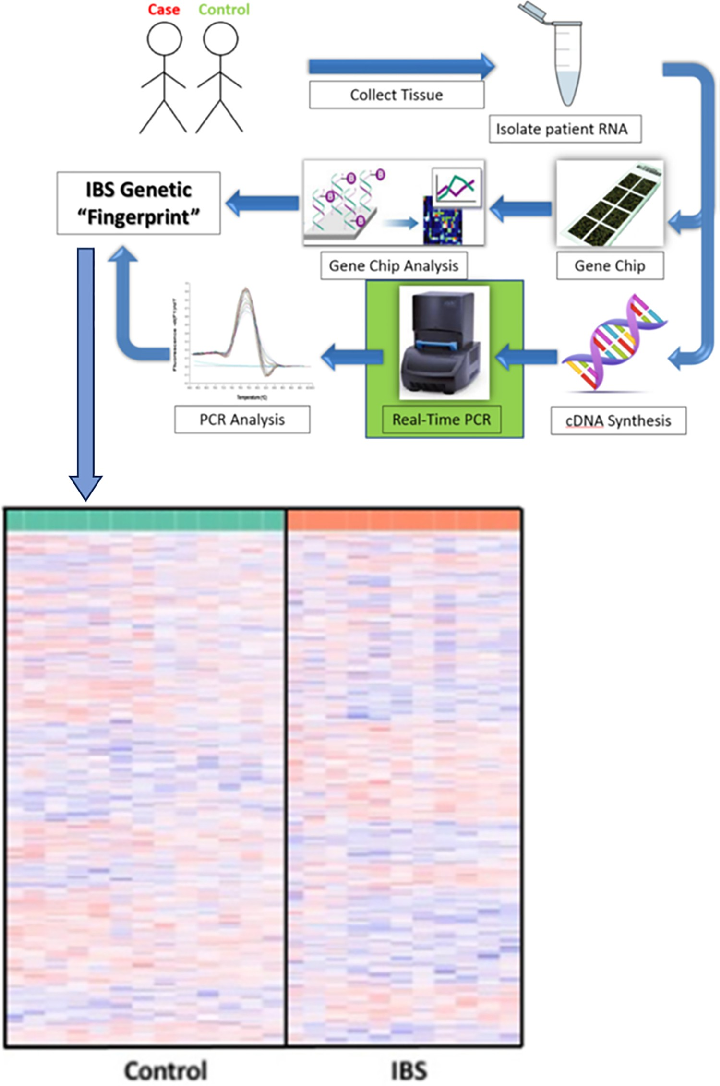
Figure 2
Workflow and DNA microarray analysis. Workflow in the acquisition of an IBS genetic “fingerprint” from patient sample to transcriptomic analysis.
chart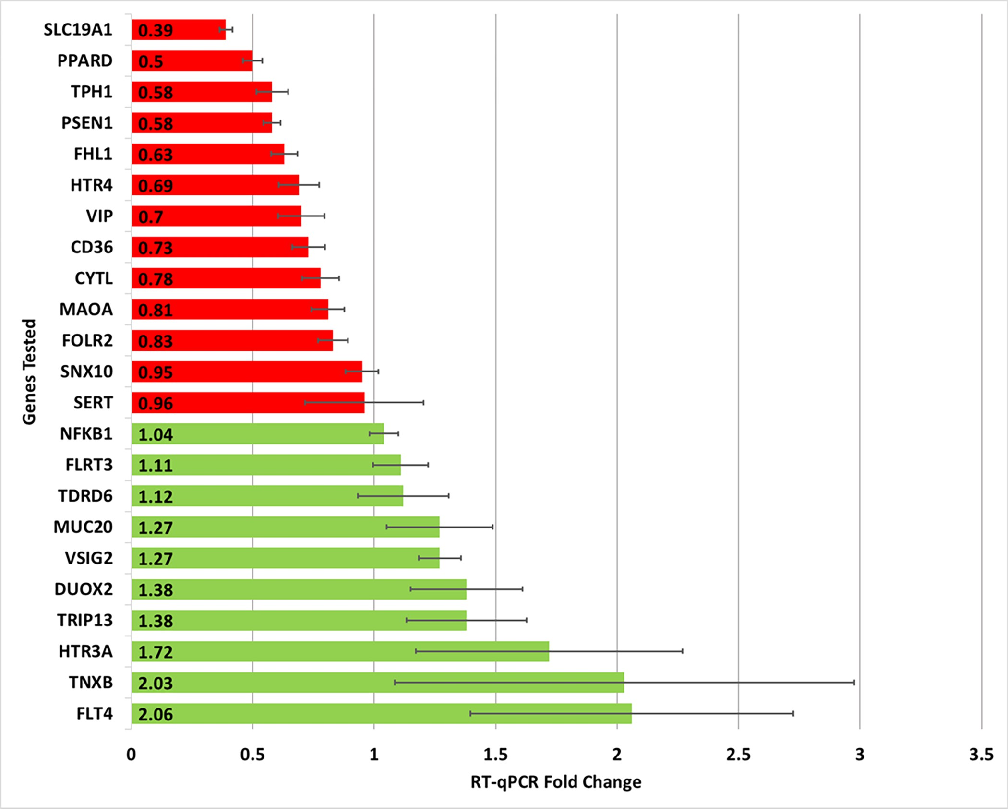
Figure 3
Gene expression fold change in IBS patients relative to control patients using RT-qPCR testing. In total, 29 genes of interest were evaluated with only 23 being reported here (only those genes with at least two independent RT-qPCR plate replicates are included).
chartFigure 4
Chart
1008 × 843px
· 105,2 Kio
Source Paper
Identification of putative transcriptomic biomarkers in irritable bowel syndrome (IBS): Differential gene expression and regulation of TPH1 and SERT by …Cite This Figure
 > Source: Aleksandra Grozić et al. "Identification of putative transcriptomic biomarkers in irritable bowel syndrome." *PloS one*, 2022. PMID: [36264926](https://pubmed.ncbi.nlm.nih.gov/36264926/)
<figure>
  <img src="https://pdfs.citedhealth.com/figures/36264926/402.png" alt="IBS-Associated gene regulation by 1,25D. The mRNA levels of each gene were determined using quantitative real-time polymerase chain reaction (RTqPCR) for a total of three to six replicates." />
  <figcaption>Figure 4. IBS-Associated gene regulation by 1,25D. The mRNA levels of each gene were determined using quantitative real-time polymerase chain reaction (RTqPCR) for a total of three to six replicates.<br>  Source: Aleksandra Grozić et al. "Identification of putative transcriptomic biomarkers in irritable bowel syndrome." <em>PloS one</em>, 2022. PMID: <a href="https://pubmed.ncbi.nlm.nih.gov/36264926/">36264926</a></figcaption>
</figure>