Description
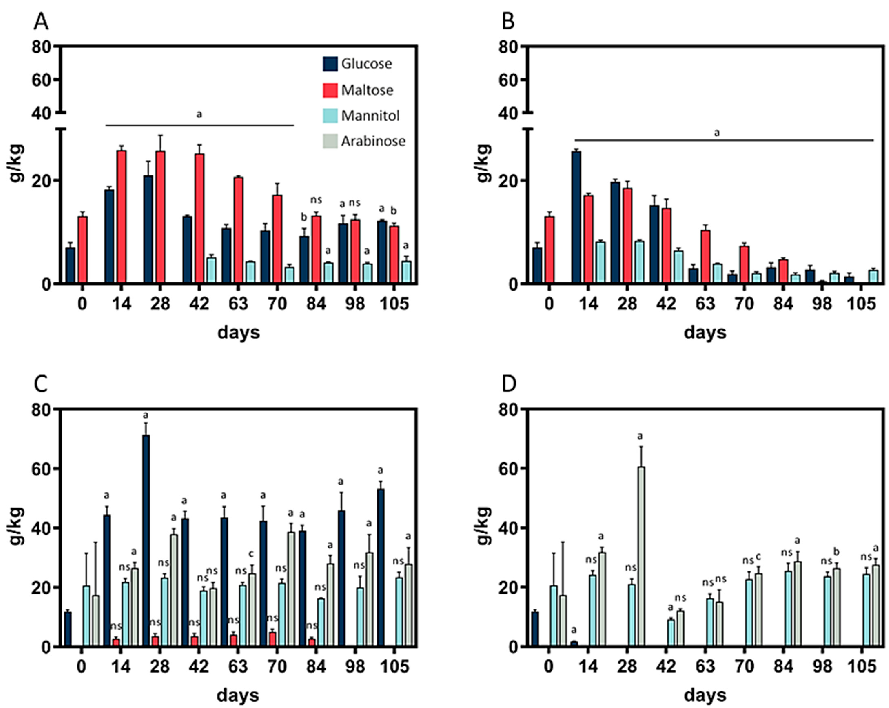
Arabinose, glucose, maltose, and mannitol contents of sourdough. (A) Wheat sourdough; 4 °C; W700.
More Figures from This Paper
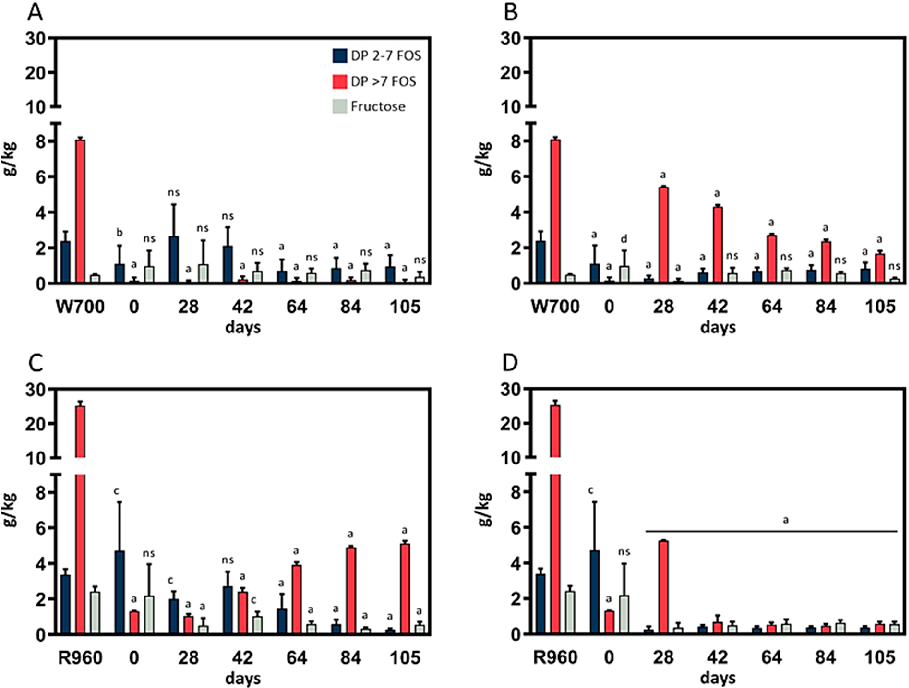
Figure 6
Fructose, DP 2–7 FOS, and DP >7 FOS content of sourdough (35 g water; 35 g flour). p < 0.05 (c), p < 0.01 (b), and p < 0.0001 (a) indicate significant differences from the control.
chart
Figure 7
Statistical analysis from research investigating FODMAP Fingerprinting of Bakery Products and Sourdoughs, comparing treatment groups and control conditions.
chart
Figure 9
Graphical representation of outcomes in a study of FODMAP Fingerprinting of Bakery Products and Sourdoughs, highlighting trends observed across experimental conditions.
chart
Figure 10
Quantitative data from a study on FODMAP Fingerprinting of Bakery Products and Sourdoughs, presenting measured outcomes relevant to the investigation of fermentable oligo-, di-, and monosaccharides and polyols (FODMAPs) are associated with digestive disorders and with d.
chartFigure 8
ChartSource Paper
FODMAP Fingerprinting of Bakery Products and Sourdoughs: Quantitative Assessment and Content Reduction through Fermentation.Cite This Figure
 > Source: Johannes Pitsch et al. "FODMAP Fingerprinting of Bakery Products and Sourdoughs: Quantitative Assessment." *Foods (Basel, Switzerland)*, 2021. PMID: [33921672](https://pubmed.ncbi.nlm.nih.gov/33921672/)
<figure>
  <img src="https://pdfs.citedhealth.com/figures/33921672/219.png" alt="Arabinose, glucose, maltose, and mannitol contents of sourdough. (A) Wheat sourdough; 4 °C; W700." />
  <figcaption>Figure 8. Arabinose, glucose, maltose, and mannitol contents of sourdough. (A) Wheat sourdough; 4 °C; W700.<br>  Source: Johannes Pitsch et al. "FODMAP Fingerprinting of Bakery Products and Sourdoughs: Quantitative Assessment." <em>Foods (Basel, Switzerland)</em>, 2021. PMID: <a href="https://pubmed.ncbi.nlm.nih.gov/33921672/">33921672</a></figcaption>
</figure>