Lactase Abbildungen
7 Abbildungen aus begutachteter Forschung
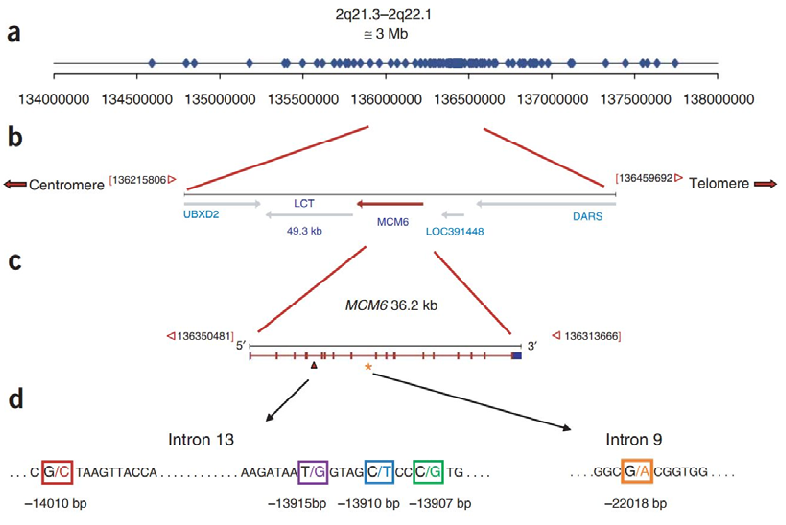
Genetic map of the lactase (LCT) and MCM6 gene region displays the locations of key single nucleotide polymorphisms associated with lactase persistence and non-persistence phenotypes across populations.
Lactose Intolerance in Adults: Biological Mechanism and Dietary Management.
Dietary management strategies for lactose intolerance are summarized, including enzyme supplementation, dairy product selection, and gradual tolerance-building approaches.
Lactose Intolerance in Adults: Biological Mechanism and Dietary Management.
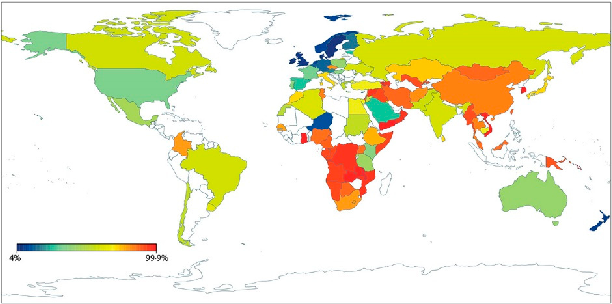
Geographic distribution of lactase non-persistence frequencies reveals wide variation across world populations, with highest persistence rates in Northern European and certain African and Middle Eastern pastoralist populations. East Asian and Native American populations show near-universal non-persistence.
Lactose Intolerance, Dairy Avoidance, and Treatment Options.
![Figure 1. In the presence of an adequate amount of lactase, lactose is hydrolysed into galactose (Gal) and glucose (Glu), which are rapidly absorbed into the bloodstream, together with H2O molecules (modified from [5]).](https://pdfs.citedhealth.com/figures/30388735/64.png)
Schematic showing the enzymatic hydrolysis of lactose by lactase into galactose and glucose, which are then absorbed into the bloodstream. In lactase-sufficient individuals, this process occurs efficiently in the small intestinal brush border.
Lactose Maldigestion, Malabsorption, and Intolerance: A Comprehensive Review with a Focus on …
![Figure 2. Some of the most important single nucleotide polymorphisms in the lactase gene (modified from [13]).](https://pdfs.citedhealth.com/figures/30388735/100.png)
Map of key single nucleotide polymorphisms (SNPs) in the lactase gene that regulate lactase persistence into adulthood. These genetic variants explain much of the population-level variation in the ability to digest lactose.
Lactose Maldigestion, Malabsorption, and Intolerance: A Comprehensive Review with a Focus on …
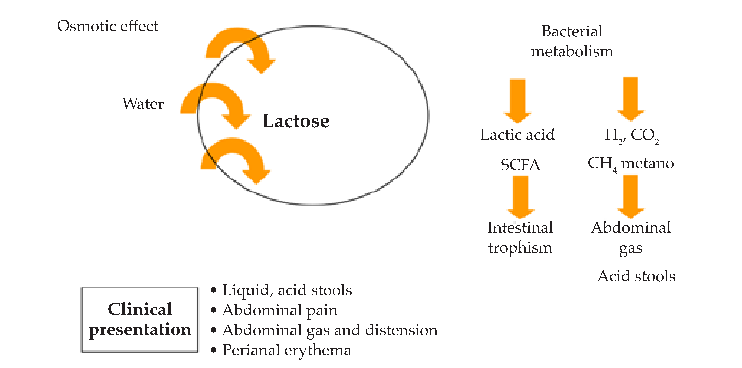
Pathophysiology of lactose intolerance illustrating how undigested lactose causes symptoms through osmotic effects in the intestinal lumen and bacterial fermentation producing hydrogen, carbon dioxide, and methane gases.
Lactose intolerance: myths and facts. An update.
Diagnostic algorithm or classification scheme for lactose intolerance, distinguishing between primary (genetic), secondary (disease-related), and congenital forms of lactase deficiency.
Lactose intolerance: myths and facts. An update.