عملية البحث
477 أشكال من أبحاث محكّمة
![Figure 1. In the presence of an adequate amount of lactase, lactose is hydrolysed into galactose (Gal) and glucose (Glu), which are rapidly absorbed into the bloodstream, together with H2O molecules (modified from [5]).](https://pdfs.citedhealth.com/figures/30388735/64.png)
Schematic showing the enzymatic hydrolysis of lactose by lactase into galactose and glucose, which are then absorbed into the bloodstream. In lactase-sufficient individuals, this process occurs efficiently in the small intestinal brush border.
Lactose Maldigestion, Malabsorption, and Intolerance: A Comprehensive Review with a Focus on …
![Figure 2. Some of the most important single nucleotide polymorphisms in the lactase gene (modified from [13]).](https://pdfs.citedhealth.com/figures/30388735/100.png)
Map of key single nucleotide polymorphisms (SNPs) in the lactase gene that regulate lactase persistence into adulthood. These genetic variants explain much of the population-level variation in the ability to digest lactose.
Lactose Maldigestion, Malabsorption, and Intolerance: A Comprehensive Review with a Focus on …
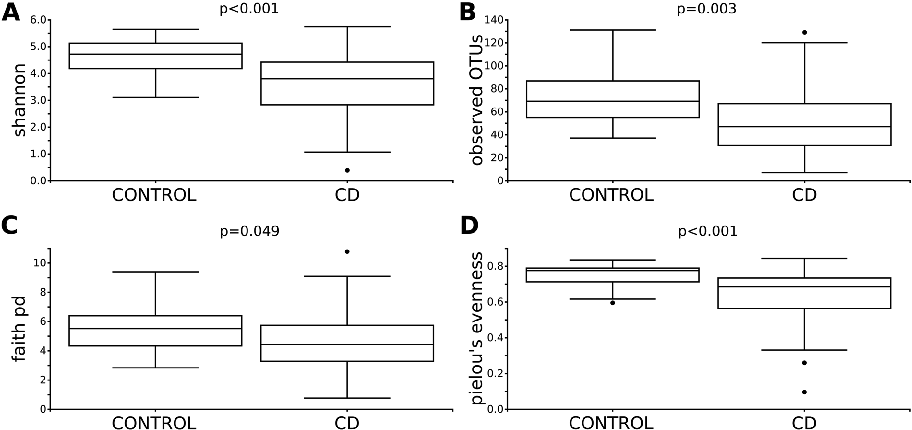
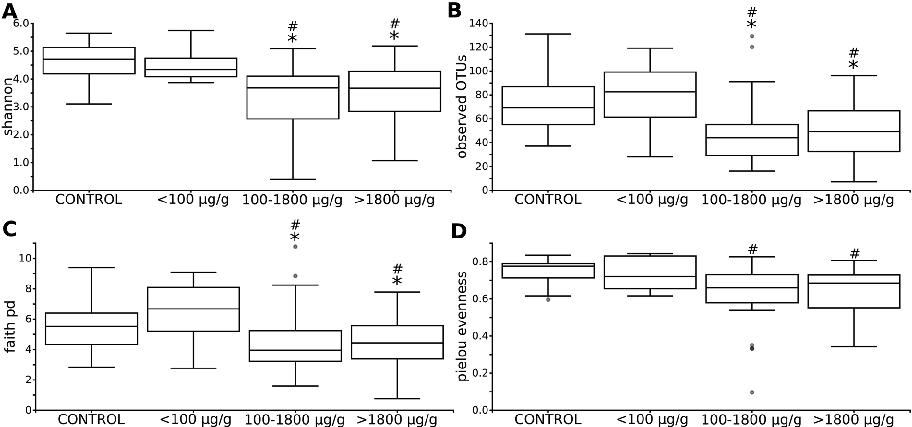
Microbial diversity comparison between healthy children and treatment-naive pediatric patients with newly diagnosed Crohn's disease. Alpha or beta diversity metrics reveal differences in the intestinal microbiome composition at disease onset.
Differences in the intestinal microbiome of healthy children and patients with newly …
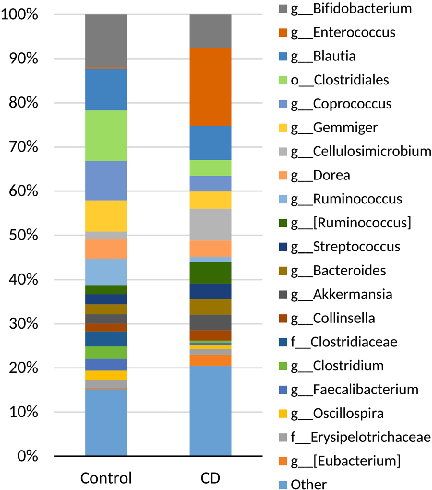
Taxonomic composition analysis showing the relative abundance of major bacterial phyla or families in stool samples from pediatric Crohn's disease patients versus healthy controls.
Differences in the intestinal microbiome of healthy children and patients with newly …
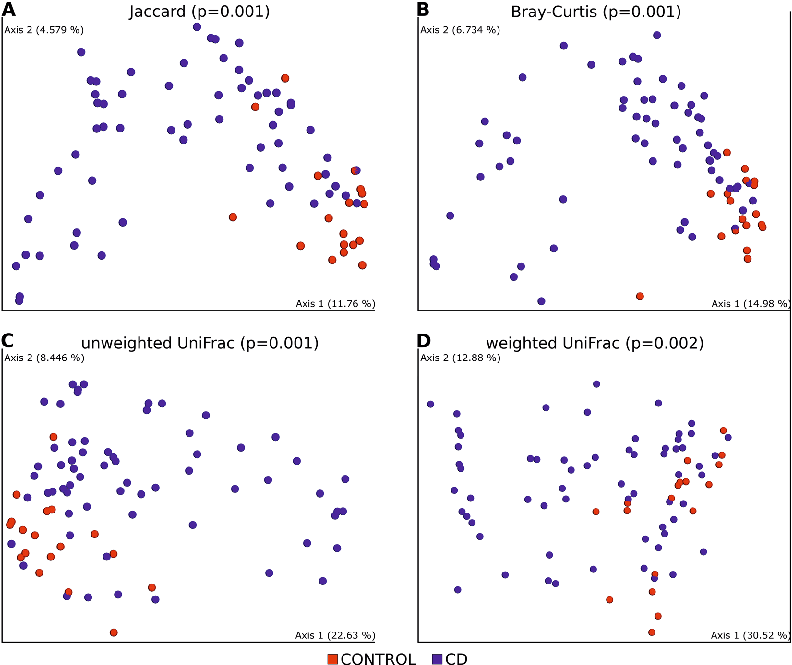
Principal coordinate analysis or ordination plot illustrating the separation in gut microbial community structure between children with newly diagnosed Crohn's disease and age-matched healthy controls.
Differences in the intestinal microbiome of healthy children and patients with newly …
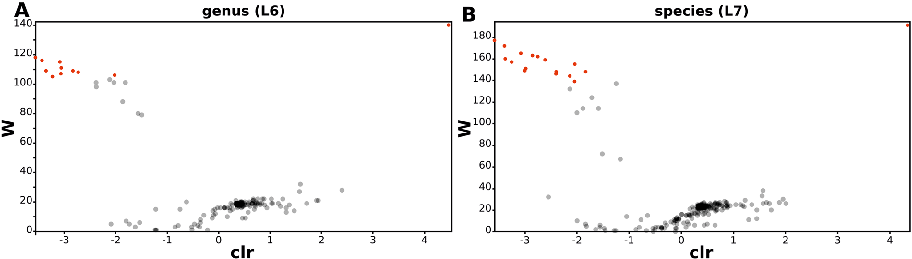
Differential abundance analysis identifying specific bacterial taxa that are significantly enriched or depleted in the intestinal microbiome of treatment-naive pediatric Crohn's disease patients.
Differences in the intestinal microbiome of healthy children and patients with newly …
Correlation analysis or network diagram showing relationships between specific gut bacterial taxa and clinical parameters in pediatric Crohn's disease at the time of diagnosis.
Differences in the intestinal microbiome of healthy children and patients with newly …
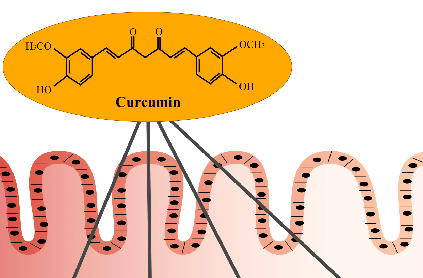
Curcumin's activity in the intestinal mucosa is illustrated, highlighting its anti-inflammatory mechanisms in the gastrointestinal tract. The diagram depicts how curcumin may modulate immune signaling pathways relevant to inflammatory bowel disease, including Crohn's disease and ulcerative colitis.
Curcumin and inflammatory bowel disease: potential and limits of innovative treatments.
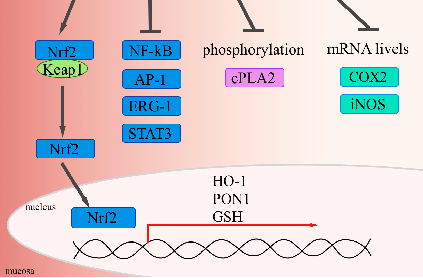
Molecular pathways and cellular targets of curcumin in inflammatory bowel disease are presented. The anti-oxidant and anti-inflammatory properties of curcumin are linked to its potential therapeutic applications in managing chronic gastrointestinal inflammation.
Curcumin and inflammatory bowel disease: potential and limits of innovative treatments.
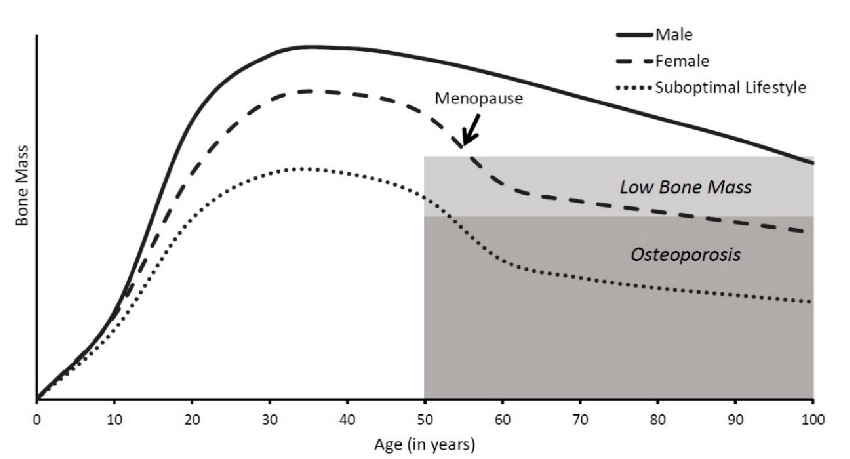
Bone mass changes throughout the human lifespan are charted, showing rapid accumulation during childhood, peak bone mass around age 30, and subsequent gradual decline. Females typically experience accelerated bone loss after menopause, underscoring the importance of adequate calcium intake in earlier decades.
Lactose Intolerance and Bone Health: The Challenge of Ensuring Adequate Calcium Intake.
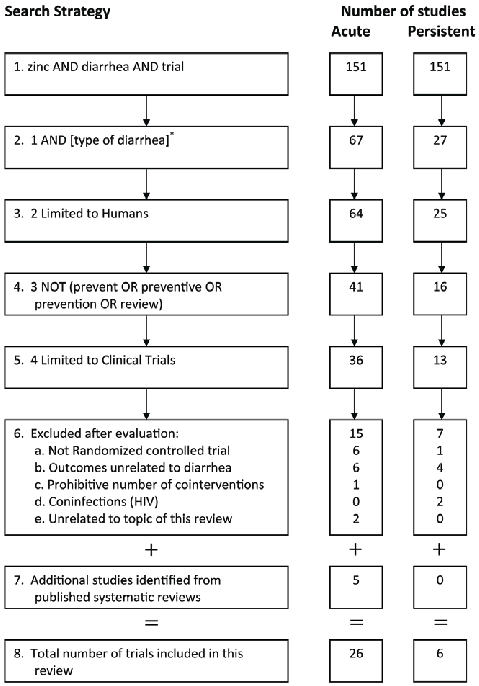
A PRISMA-style flowchart details the study selection protocol for this systematic review of zinc supplementation in diarrhea, showing the screening and inclusion criteria applied to identify eligible trials.
Therapeutic value of zinc supplementation in acute and persistent diarrhea: a systematic …
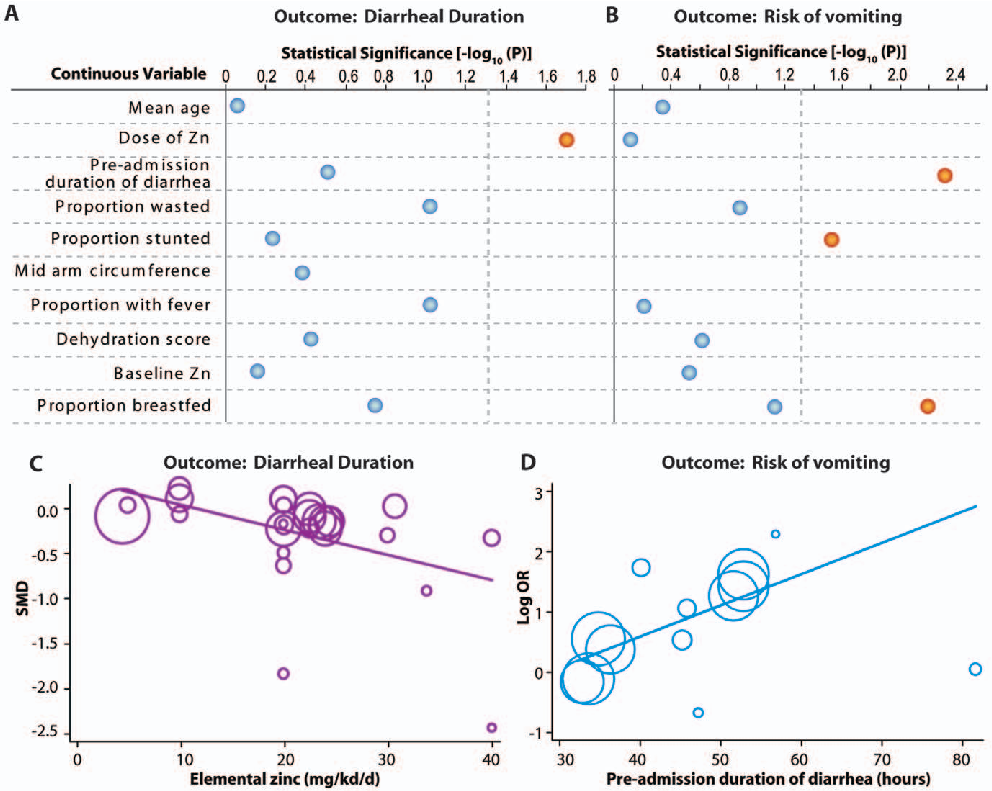
Subgroup comparisons of zinc dosage and formulation effects on diarrhea outcomes are depicted, highlighting dose-response relationships observed across studies.
Therapeutic value of zinc supplementation in acute and persistent diarrhea: a systematic …
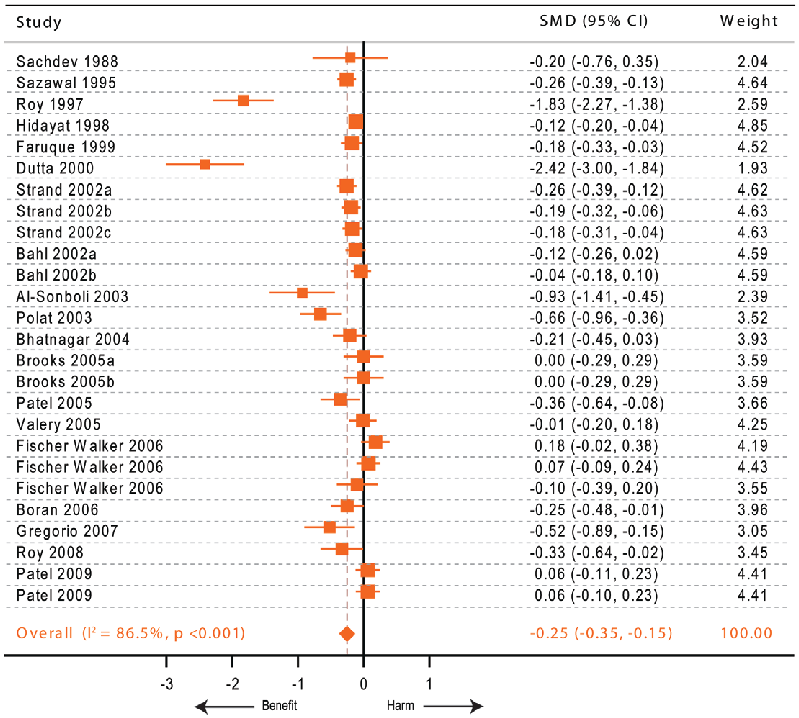
Pooled results from clinical trials assessing zinc's therapeutic value in reducing diarrhea duration and severity are presented, with subgroup analyses by diarrhea type.
Therapeutic value of zinc supplementation in acute and persistent diarrhea: a systematic …
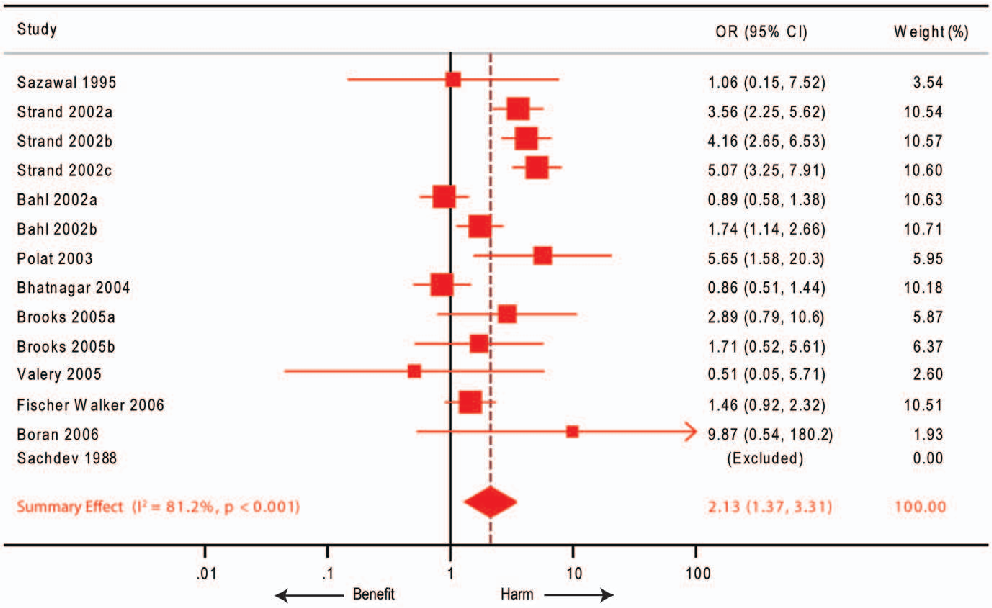
Effect size estimates for zinc supplementation across different age groups and diarrhea classifications are compared, indicating varying degrees of clinical benefit.
Therapeutic value of zinc supplementation in acute and persistent diarrhea: a systematic …
Alpha diversity indices of fecal microbiota are plotted for treated versus placebo groups, indicating whether probiotic supplementation altered overall bacterial community richness.
Effects of Bifidobacterium longum and Lactobacillus rhamnosus on Gut Microbiota in Patients …
Lactose tolerance test outcomes are compared between intervention groups, with symptom severity mapped against breath hydrogen concentrations.
Effects of Bifidobacterium longum and Lactobacillus rhamnosus on Gut Microbiota in Patients …
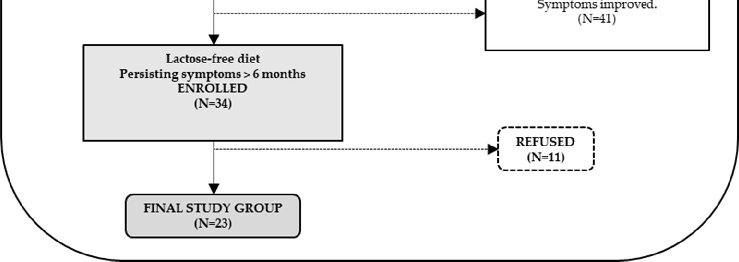
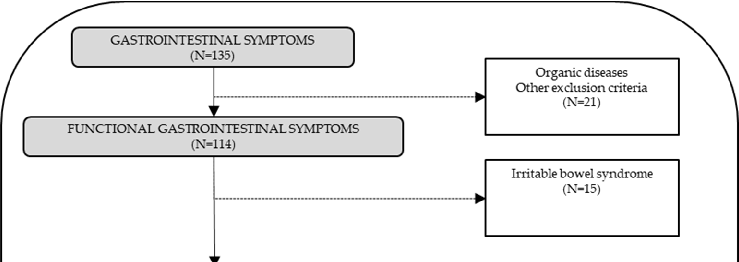
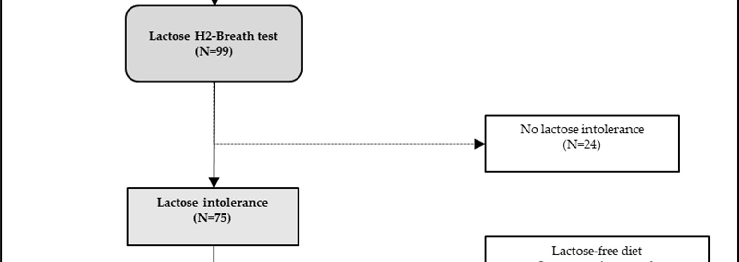
A CONSORT flow chart traces patient screening and enrollment for this trial of Bifidobacterium longum and Lactobacillus rhamnosus in lactose-intolerant individuals, detailing exclusions for organic diseases and final group assignments.
Effects of Bifidobacterium longum and Lactobacillus rhamnosus on Gut Microbiota in Patients …
Fecal short-chain fatty acid concentrations are measured across treatment groups, reflecting metabolic activity changes in the gut microbiome following probiotic administration.
Effects of Bifidobacterium longum and Lactobacillus rhamnosus on Gut Microbiota in Patients …
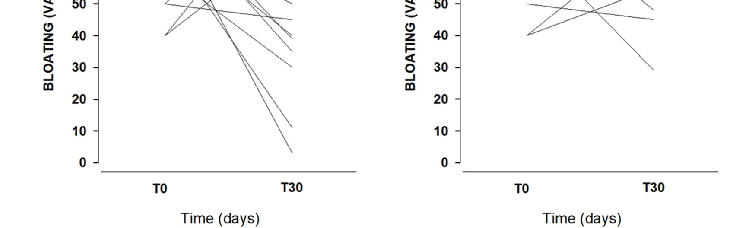
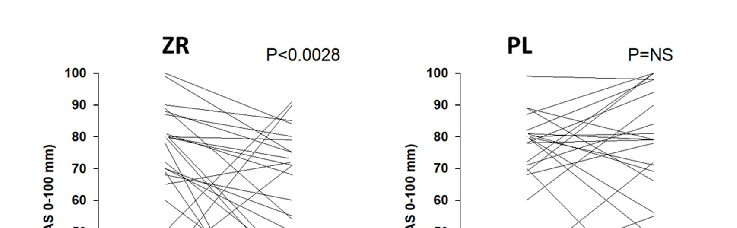
Individual patient trajectories for bloating severity, measured on a 0-100 mm visual analogue scale, are plotted at baseline and after 30 days for both the probiotic treatment and placebo groups.
Effects of Bifidobacterium longum and Lactobacillus rhamnosus on Gut Microbiota in Patients …
Symptom improvement scores for lactose-intolerant patients receiving a combined Bifidobacterium longum and Lactobacillus rhamnosus preparation are compared with placebo responses over the treatment period.
Effects of Bifidobacterium longum and Lactobacillus rhamnosus on Gut Microbiota in Patients …

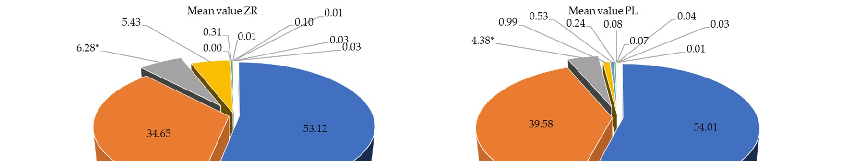
Relative proportions of bacterial phyla in fecal samples are compared between probiotic-treated and placebo groups, revealing shifts in gut microbiota composition following Bifidobacterium longum and Lactobacillus rhamnosus supplementation.
Effects of Bifidobacterium longum and Lactobacillus rhamnosus on Gut Microbiota in Patients …
Hydrogen breath test results before and after probiotic supplementation are presented, indicating alterations in lactose fermentation patterns associated with treatment.
Effects of Bifidobacterium longum and Lactobacillus rhamnosus on Gut Microbiota in Patients …
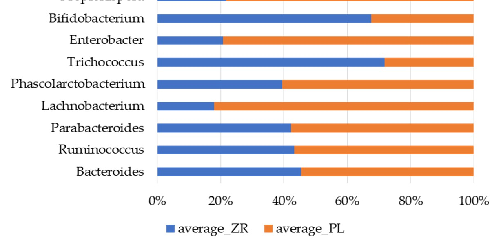
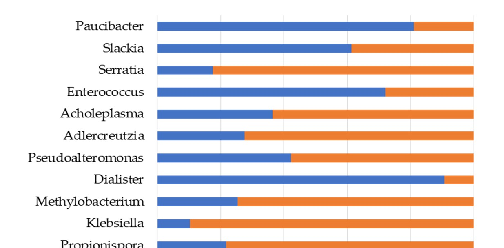
Bacterial genera showing statistically significant differences between probiotic-treated and placebo patients are depicted, highlighting specific microbial populations responsive to Bifidobacterium and Lactobacillus supplementation.
Effects of Bifidobacterium longum and Lactobacillus rhamnosus on Gut Microbiota in Patients …
NF-κB signaling pathway activation in intestinal cells is measured with and without butyrate pre-treatment following LPS challenge, demonstrating the short-chain fatty acid's inhibitory capacity.
Butyrate attenuates lipopolysaccharide-induced inflammation in intestinal cells and Crohn's mucosa through modulation …
الصفحة 5 من 20