Описание
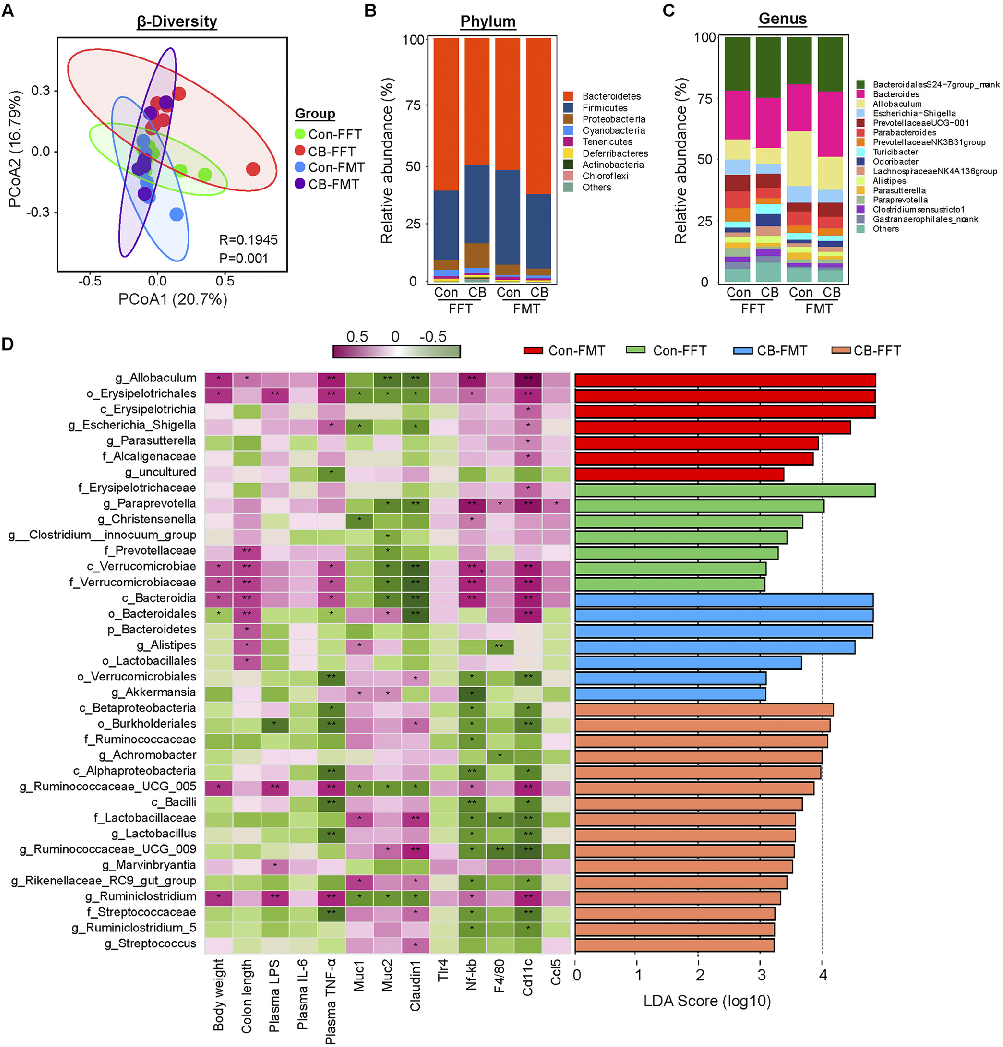
Alpha and beta diversity metrics reveal shifts in gut microbial community structure following probiotic intervention. This figure compares microbiome diversity indices between C. butyricum-treated and control groups.
More Figures from This Paper
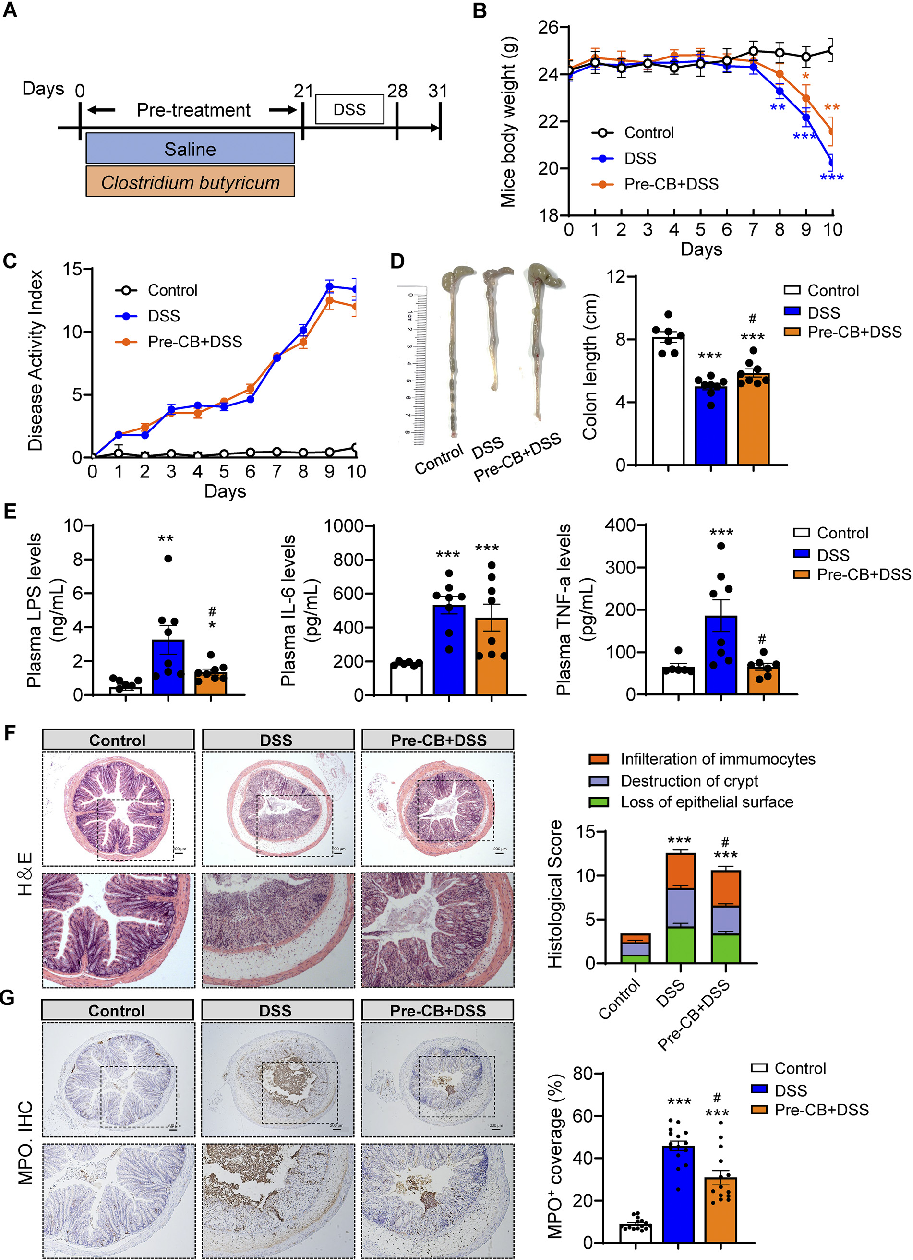
Figure 5
Histological analysis of colonic tissue reveals the extent of inflammatory infiltration and mucosal damage. This figure compares histopathological scores across treatment groups in the acute experimental colitis model.
micrograph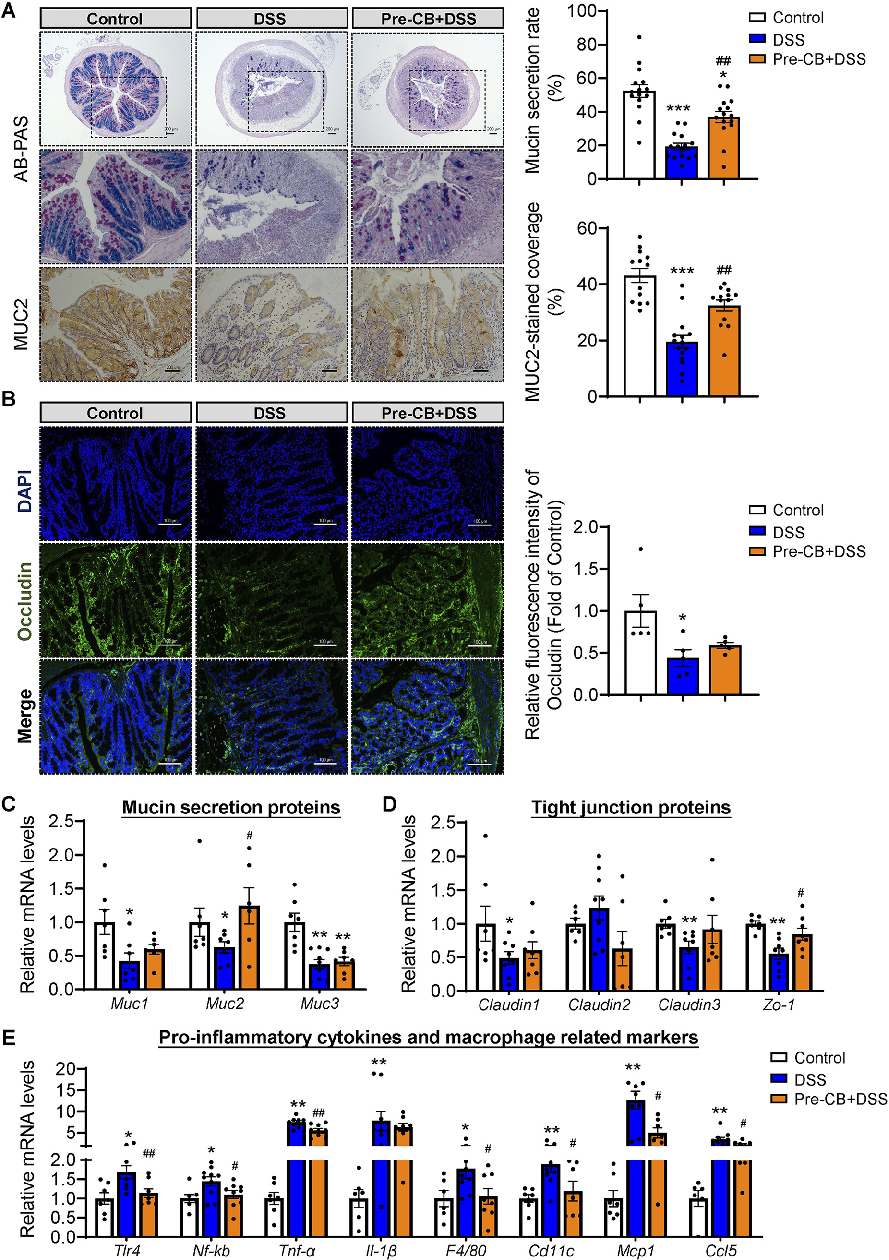
Figure 6
Pro-inflammatory cytokine levels in colonic tissue were quantified to assess the anti-inflammatory effects of C. butyricum treatment. This figure presents TNF-alpha, IL-6, and IL-1beta expression data across experimental groups.
chart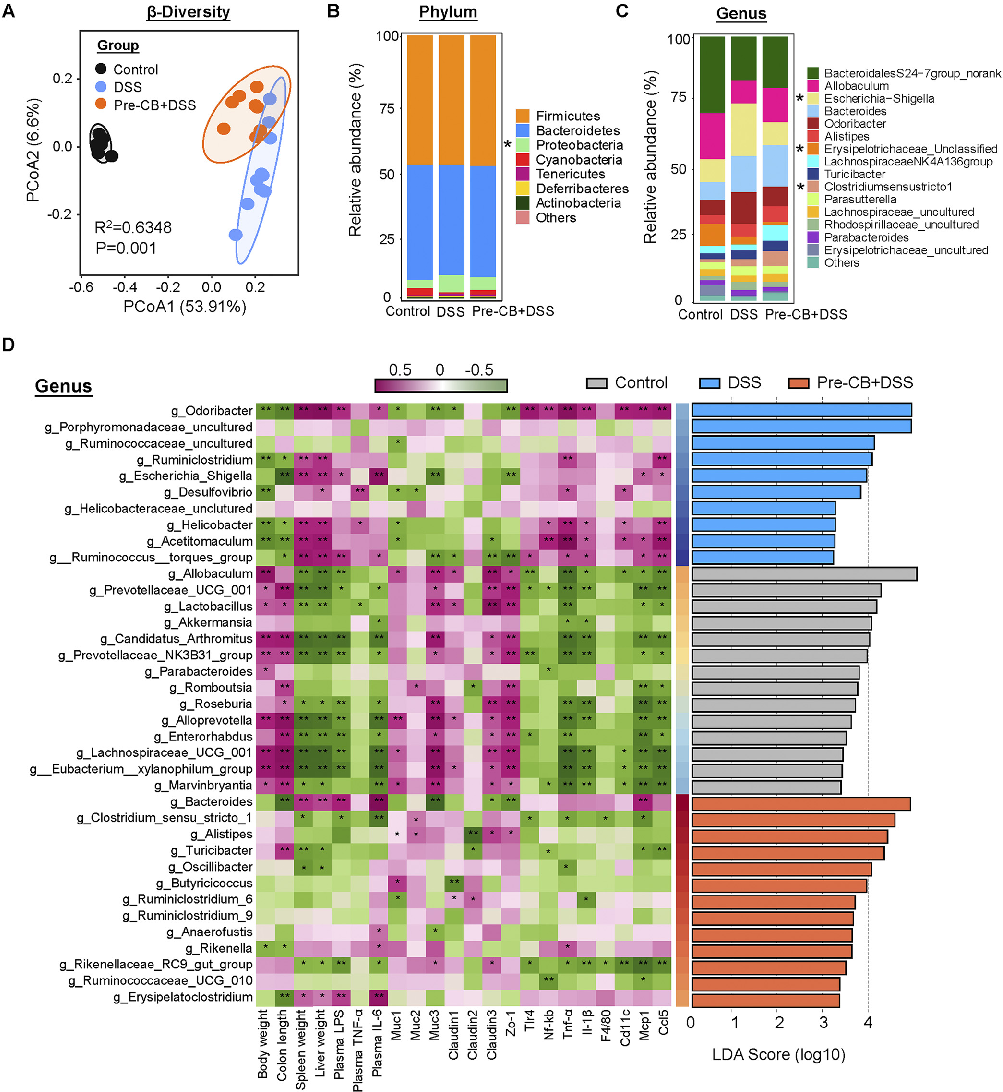
Figure 7
Tight junction protein expression indicates intestinal barrier integrity. This figure shows changes in occludin, claudin, and ZO-1 levels in colonic tissue following C. butyricum or vesicle treatment.
chart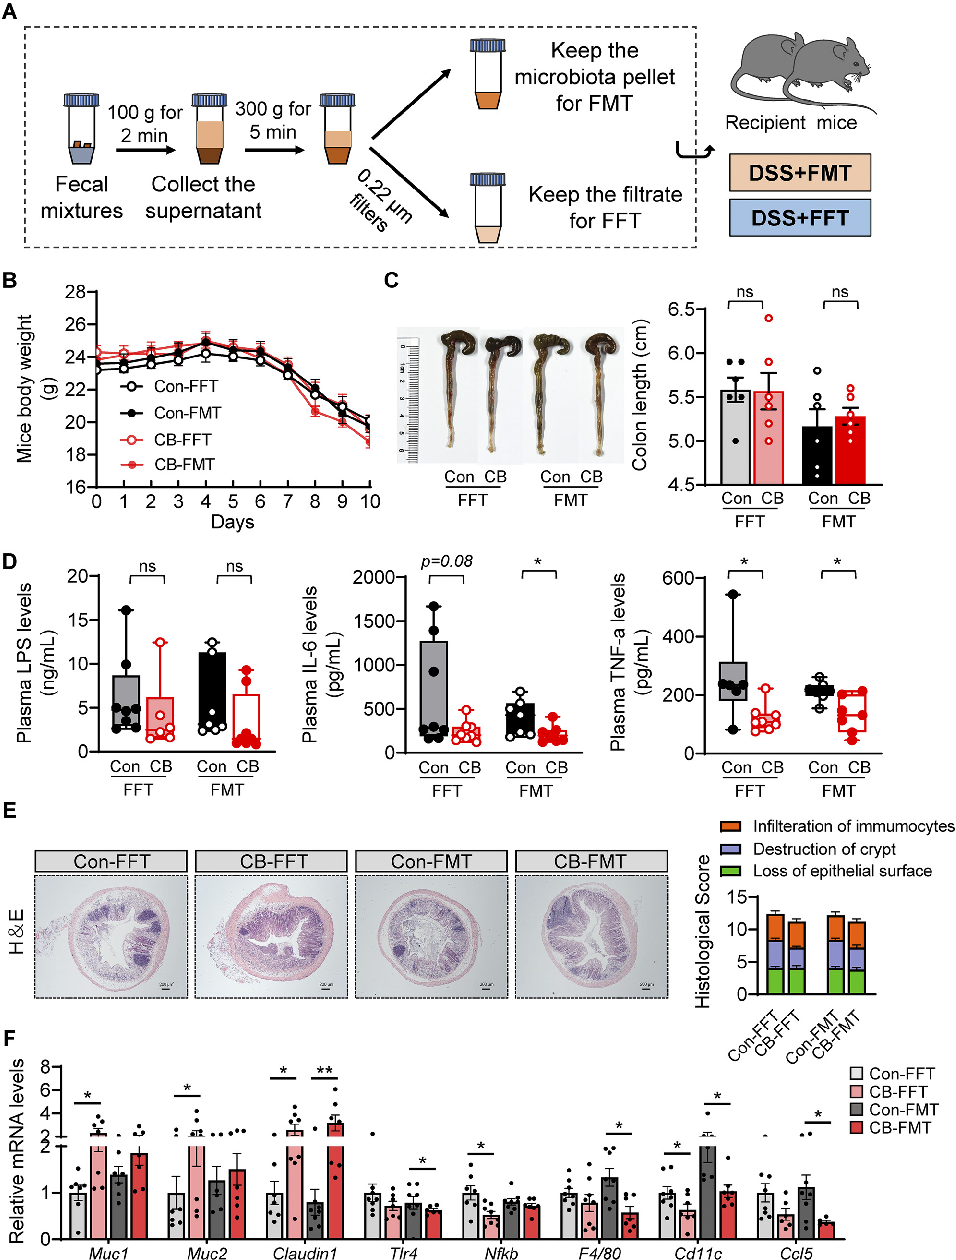
Figure 8
Gut microbiome composition was analyzed to determine how C. butyricum treatment modulates the intestinal microbial community. This figure presents 16S rRNA sequencing data showing microbial diversity and taxonomic abundance.
chart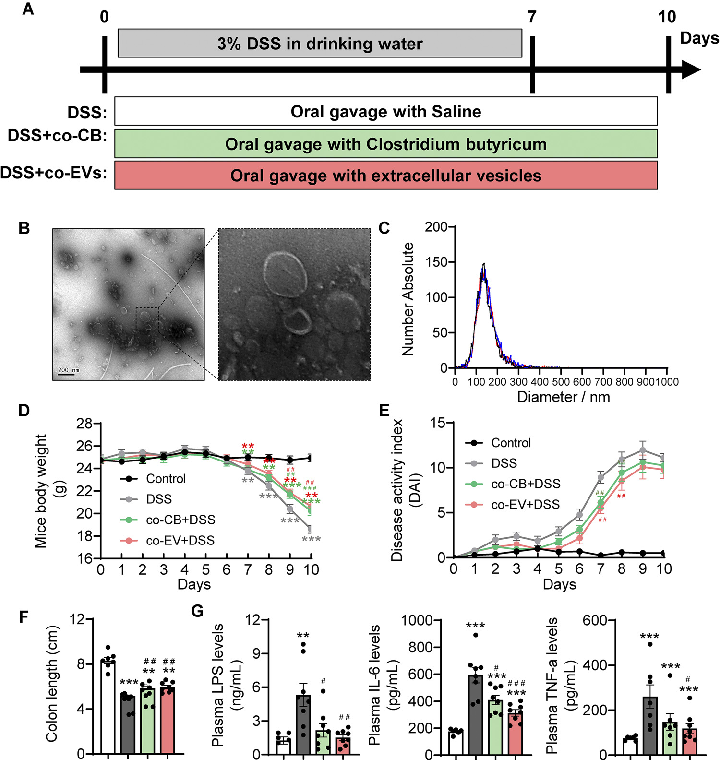
Figure 10
Specific bacterial taxa were differentially abundant in C. butyricum-treated mice compared to controls. This figure highlights the key microbial shifts associated with amelioration of colitis symptoms.
chart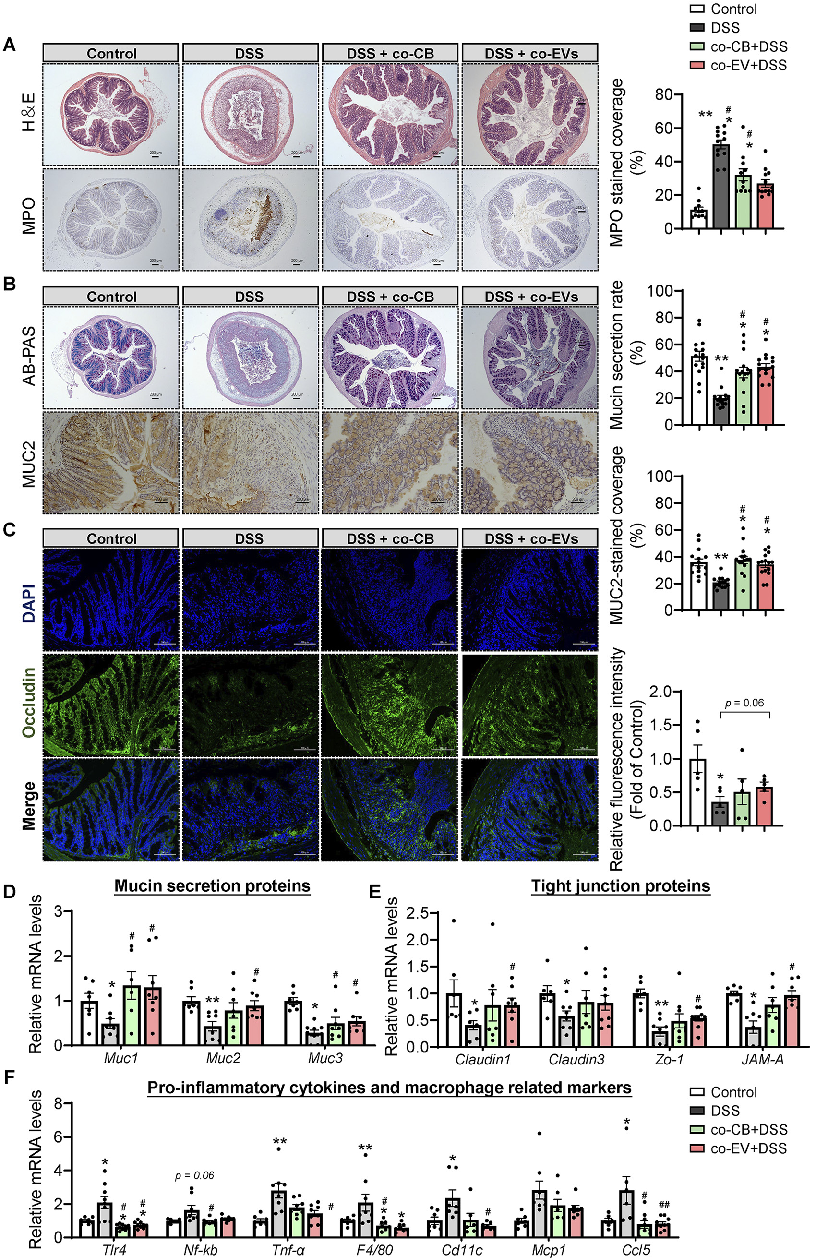
Figure 11
Short-chain fatty acid production in the gut is modulated by C. butyricum colonization. This figure presents metabolomic data on butyrate and other SCFA concentrations in the colonic lumen.
chartFigure 9
ChartSource Paper
Clostridium butyricum and Its Derived Extracellular Vesicles Modulate Gut Homeostasis and Ameliorate Acute Experimental Colitis.Cite This Figure
 > Source: Lingyan Ma et al. "Clostridium butyricum and Its Derived Extracellular Vesicles Modulate Gut Homeos." *Microbiology spectrum*, 2022. PMID: [35762770](https://pubmed.ncbi.nlm.nih.gov/35762770/)
<figure>
  <img src="https://pdfs.citedhealth.com/figures/35762770/171.png" alt="Alpha and beta diversity metrics reveal shifts in gut microbial community structure following probiotic intervention. This figure compares microbiome diversity indices between C. butyricum-treated and control groups." />
  <figcaption>Figure 9. Alpha and beta diversity metrics reveal shifts in gut microbial community structure following probiotic intervention. This figure compares microbiome diversity indices between C. butyricum-treated and control groups.<br>  Source: Lingyan Ma et al. "Clostridium butyricum and Its Derived Extracellular Vesicles Modulate Gut Homeos." <em>Microbiology spectrum</em>, 2022. PMID: <a href="https://pubmed.ncbi.nlm.nih.gov/35762770/">35762770</a></figcaption>
</figure>