説明
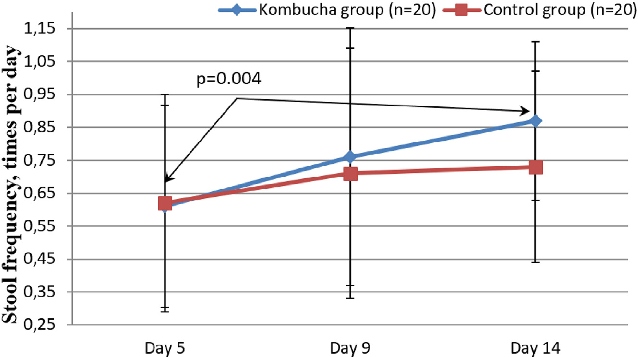
Stool frequency data comparing the kombucha intervention and control groups across the study timeline. Increased bowel movement frequency in the treatment group suggests a potential benefit of the inulin- and vitamin-enriched kombucha formulation.
More Figures from This Paper
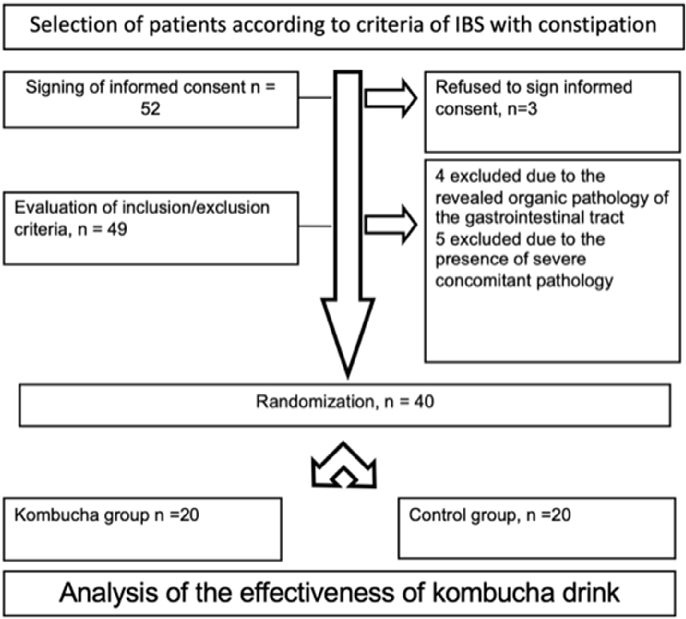
Figure 2
CONSORT flow diagram detailing patient enrollment, randomization, allocation to treatment and control groups, and final analysis in the IBS-C kombucha intervention trial. Dropout rates and reasons for exclusion are documented at each stage.
flowchart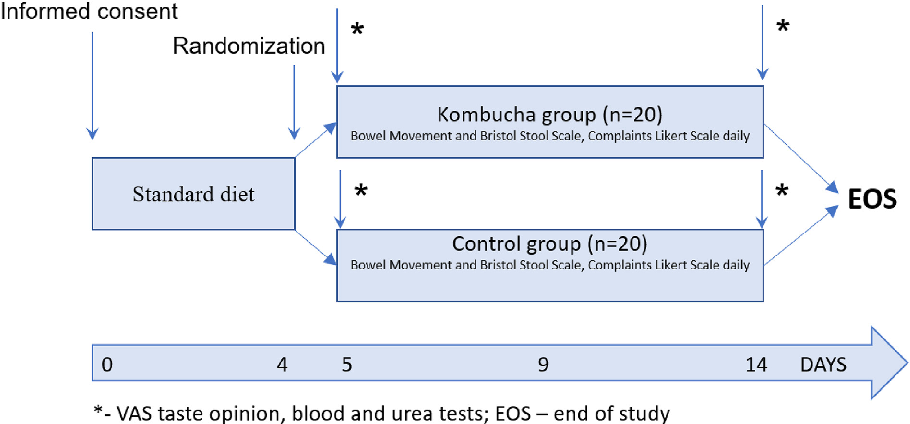
Figure 3
Study design schematic illustrating the intervention protocol, including kombucha drink composition (with inulin and vitamin supplementation), dosing schedule, and assessment timepoints across the trial period.
diagram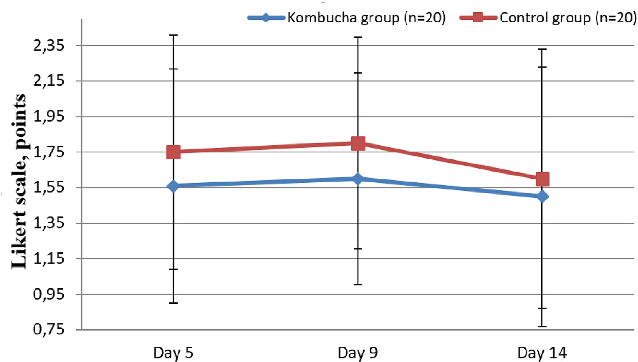
Figure 4
Comparison of bloating severity scores between the kombucha intervention group and control group over the study period. Reductions in bloating severity suggest the enriched kombucha drink may be associated with symptomatic improvement in IBS-C patients.
chart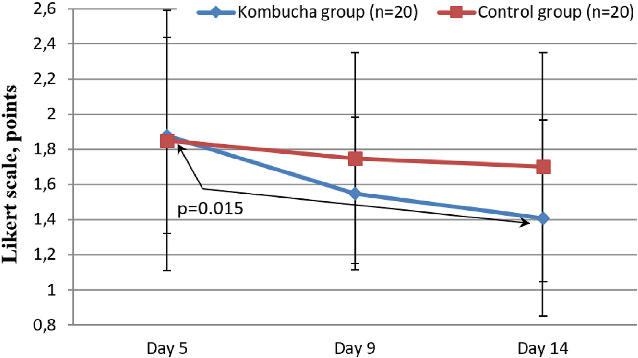
Figure 5
Assessment of the feeling of incomplete bowel emptying in IBS-C patients receiving the kombucha-based drink versus controls. Severity scores at multiple timepoints indicate a trend toward improvement in the intervention group.
chart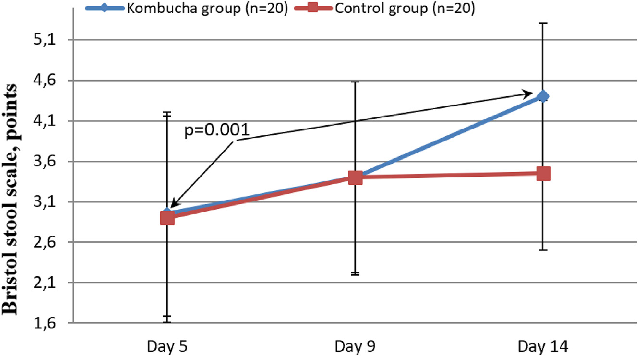
Figure 7
Stool consistency scores evaluated using the Bristol Stool Scale for both study groups. Improvements in stool consistency over the intervention period suggest the kombucha-based drink may help normalize bowel habits in IBS-C patients.
chartFigure 6
ChartSource Paper
Evaluation of the Efficacy of Kombucha-Based Drink Enriched with Inulin and Vitamins for the Management of Constipation-Predominant Irritable Bowel Syndrome …Cite This Figure
 > Source: Vasily A Isakov et al. "Evaluation of the Efficacy of Kombucha-Based Drink Enriched with Inulin and Vita." *Current developments in nutrition*, 2023. PMID: [38149073](https://pubmed.ncbi.nlm.nih.gov/38149073/)
<figure>
  <img src="https://pdfs.citedhealth.com/figures/38149073/135.png" alt="Stool frequency data comparing the kombucha intervention and control groups across the study timeline. Increased bowel movement frequency in the treatment group suggests a potential benefit of the inulin- and vitamin-enriched kombucha formulation." />
  <figcaption>Figure 6. Stool frequency data comparing the kombucha intervention and control groups across the study timeline. Increased bowel movement frequency in the treatment group suggests a potential benefit of the inulin- and vitamin-enriched kombucha formulation.<br>  Source: Vasily A Isakov et al. "Evaluation of the Efficacy of Kombucha-Based Drink Enriched with Inulin and Vita." <em>Current developments in nutrition</em>, 2023. PMID: <a href="https://pubmed.ncbi.nlm.nih.gov/38149073/">38149073</a></figcaption>
</figure>