Descrizione
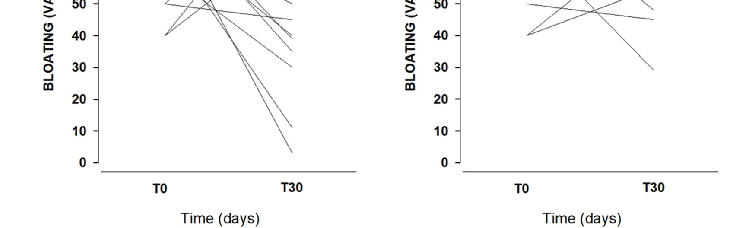
Individual patient trajectories for bloating severity, measured on a 0-100 mm visual analogue scale, are plotted at baseline and after 30 days for both the probiotic treatment and placebo groups.
More Figures from This Paper
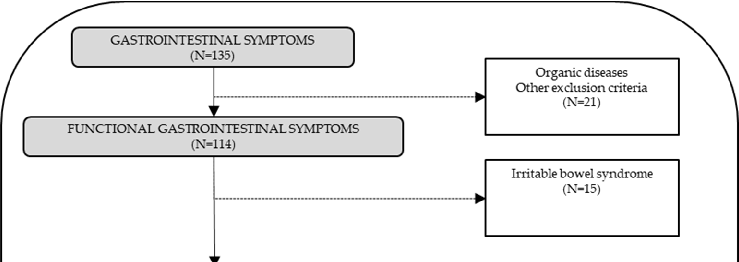
Figure 5
Alpha diversity indices of fecal microbiota are plotted for treated versus placebo groups, indicating whether probiotic supplementation altered overall bacterial community richness.
chart
Figure 6
Lactose tolerance test outcomes are compared between intervention groups, with symptom severity mapped against breath hydrogen concentrations.
chart
Figure 7
A CONSORT flow chart traces patient screening and enrollment for this trial of Bifidobacterium longum and Lactobacillus rhamnosus in lactose-intolerant individuals, detailing exclusions for organic diseases and final group assignments.
flowchart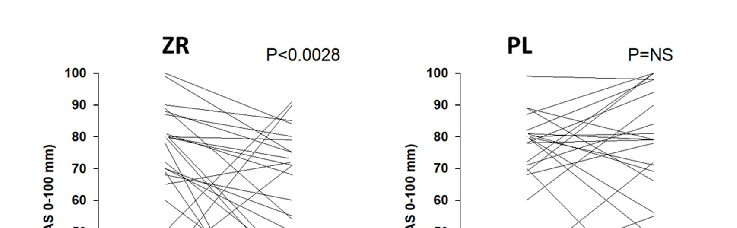
Figure 8
Fecal short-chain fatty acid concentrations are measured across treatment groups, reflecting metabolic activity changes in the gut microbiome following probiotic administration.
chart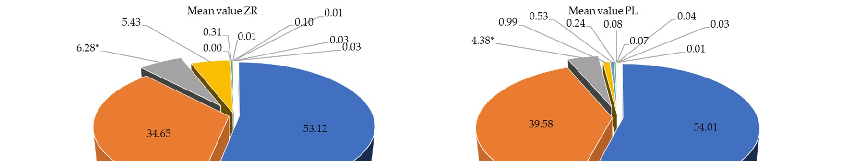
Figure 10
Symptom improvement scores for lactose-intolerant patients receiving a combined Bifidobacterium longum and Lactobacillus rhamnosus preparation are compared with placebo responses over the treatment period.
chart
Figure 11
Relative proportions of bacterial phyla in fecal samples are compared between probiotic-treated and placebo groups, revealing shifts in gut microbiota composition following Bifidobacterium longum and Lactobacillus rhamnosus supplementation.
chartFigure 9
ChartSource Paper
Effects of Bifidobacterium longum and Lactobacillus rhamnosus on Gut Microbiota in Patients with Lactose Intolerance and Persisting Functional Gastrointestinal Symptoms: …Cite This Figure
 > Source: Paola Vitellio et al. "Effects of Bifidobacterium longum and Lactobacillus rhamnosus on Gut Microbiota ." *Nutrients*, 2019. PMID: [31010241](https://pubmed.ncbi.nlm.nih.gov/31010241/)
<figure>
  <img src="https://pdfs.citedhealth.com/figures/31010241/164.png" alt="Individual patient trajectories for bloating severity, measured on a 0-100 mm visual analogue scale, are plotted at baseline and after 30 days for both the probiotic treatment and placebo groups." />
  <figcaption>Figure 9. Individual patient trajectories for bloating severity, measured on a 0-100 mm visual analogue scale, are plotted at baseline and after 30 days for both the probiotic treatment and placebo groups.<br>  Source: Paola Vitellio et al. "Effects of Bifidobacterium longum and Lactobacillus rhamnosus on Gut Microbiota ." <em>Nutrients</em>, 2019. PMID: <a href="https://pubmed.ncbi.nlm.nih.gov/31010241/">31010241</a></figcaption>
</figure>