Beschreibung
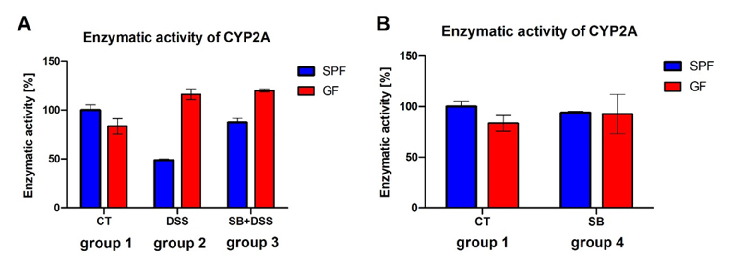
Statistical analysis from research investigating effect of DSS, comparing treatment groups and control conditions.
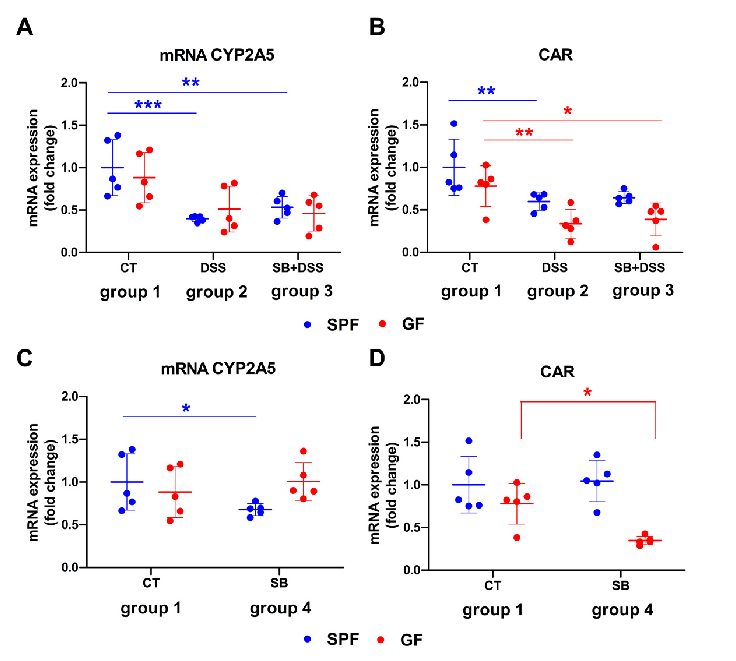
Figure 7
Chart
735 × 260px
· 63,7 KB
Source Paper
Effect of DSS-Induced Ulcerative Colitis and Butyrate on the Cytochrome P450 2A5: Contribution of the Microbiome.Cite This Figure
 > Source: Stefan Satka et al. "Effect of DSS-Induced Ulcerative Colitis and Butyrate on the Cytochrome P450 2A5." *International journal of molecular sciences*, 2022. PMID: [36232929](https://pubmed.ncbi.nlm.nih.gov/36232929/)
<figure>
  <img src="https://pdfs.citedhealth.com/figures/36232929/82.png" alt="Statistical analysis from research investigating effect of DSS, comparing treatment groups and control conditions." />
  <figcaption>Figure 7. Statistical analysis from research investigating effect of DSS, comparing treatment groups and control conditions.<br>  Source: Stefan Satka et al. "Effect of DSS-Induced Ulcerative Colitis and Butyrate on the Cytochrome P450 2A5." <em>International journal of molecular sciences</em>, 2022. PMID: <a href="https://pubmed.ncbi.nlm.nih.gov/36232929/">36232929</a></figcaption>
</figure>